CFB · METHODOLOGY · SIMS · SCORECARD
How I Built a Play-by-Play College Football Simulator, and What Eight Weeks of Grading Says It's Worth
By MVPeav · @MVPeav ·
I run a college football simulator that plays every snap of every FBS game, 10,000 times per game, every week. The numbers from it are all over this site: win percentages, projected scores, player props, the weekly scorecard. This post is the one where I show the work.
It's longer and drier than what I usually write here, on purpose. This is for the sickos that care about why it's built the way it's built, how a snap gets simulated, what got tested and thrown out, the backtest that was too good to be true, and what the grades look like against ESPN's FPI and the betting market through week 9 of 2026.
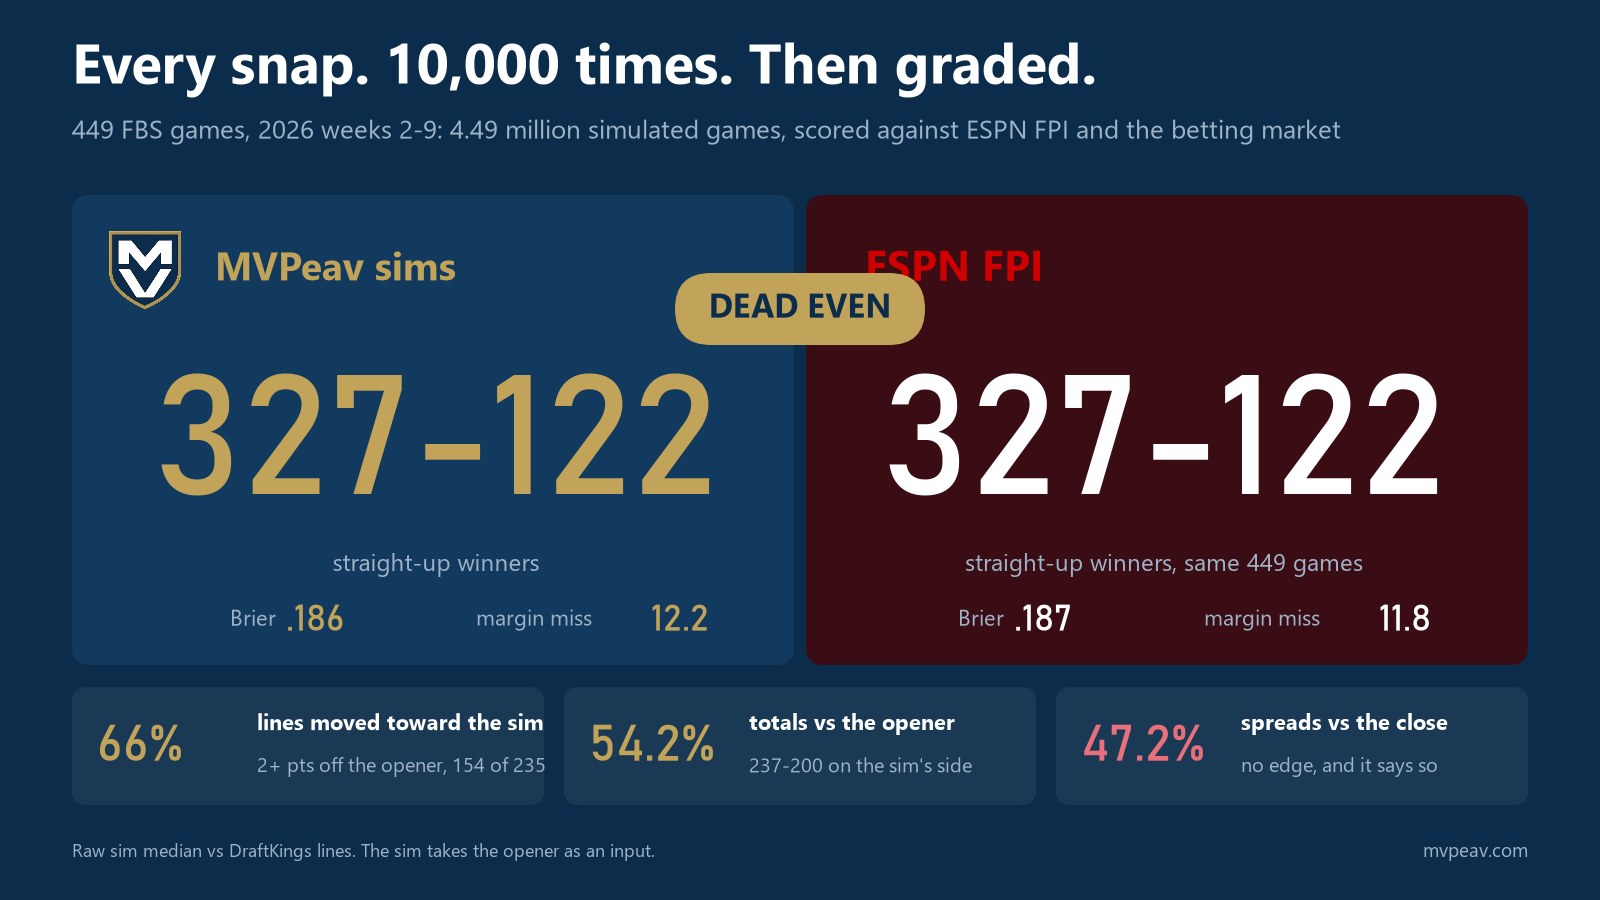
The short version. On straight-up winners and probability quality the sim is even with FPI. Its distributions are calibrated. When it disagrees with the opening line, the market moves toward it two times out of three. It has no edge against the spread, and I'll say that as plainly as the good parts.
Why Play-by-Play Instead of a Ratings Model
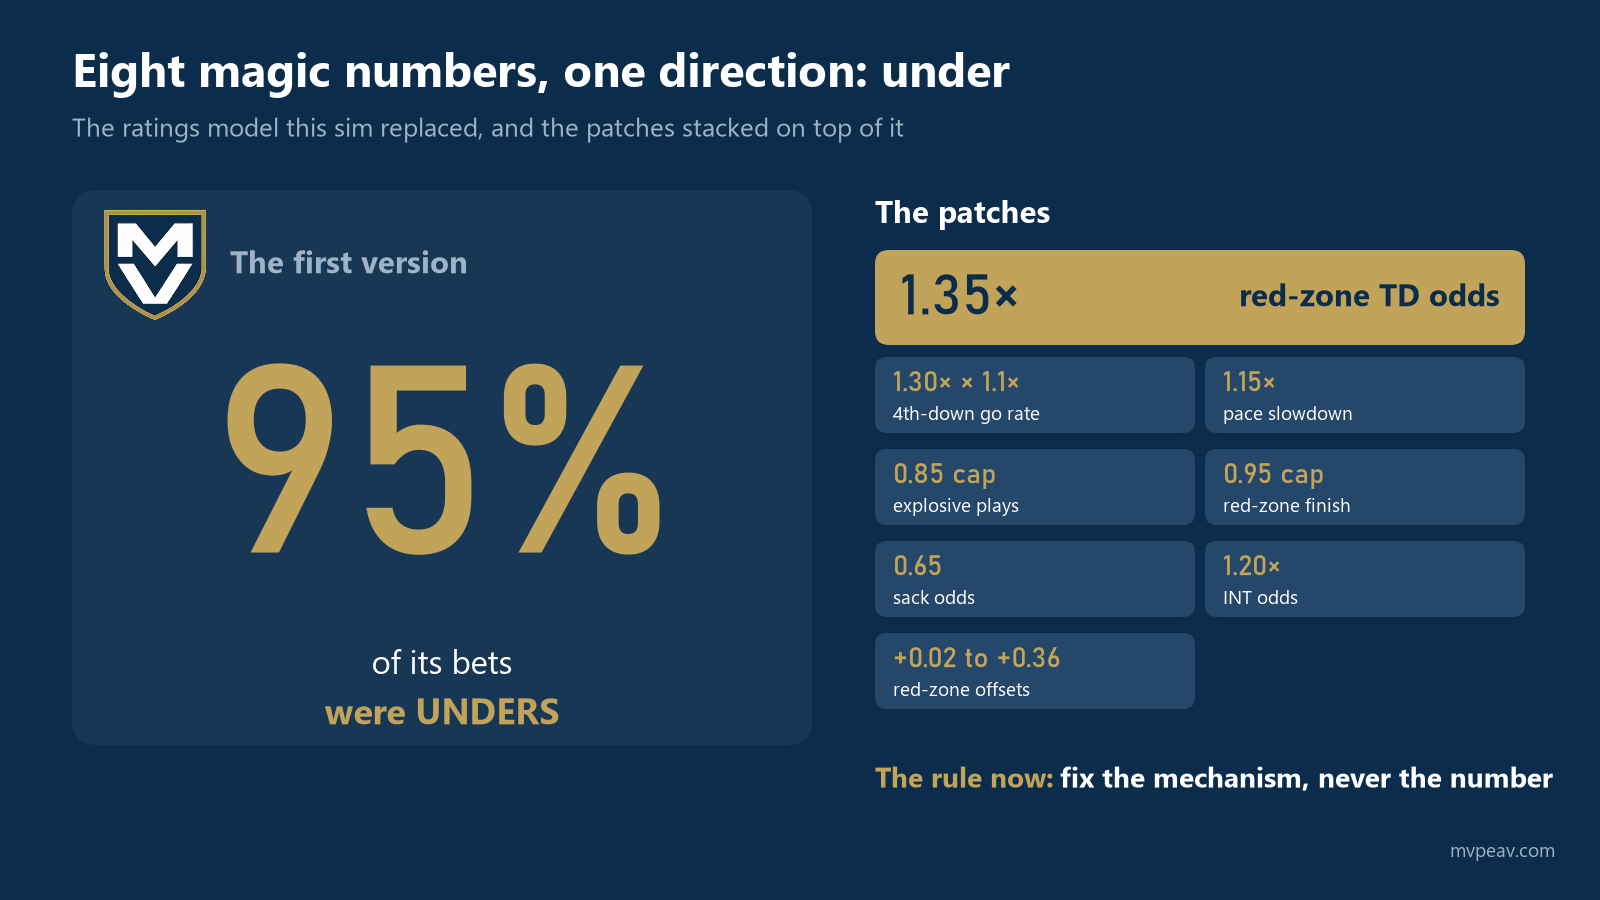
The first version of this project was a ratings model with multipliers on top. It priced player props, and it produced unders on about 95% of its bets. The cause was a hard-coded 1.35 red-zone touchdown multiplier and seven other magic numbers like it, each one added to fix a symptom of the last one. That failure is the founding document of the current sim. The first standing rule in the project's own guidelines is still "no post-hoc scalar patches, caps or stacked multipliers on sim output." If the engine is wrong, fix the mechanism, never the number that comes out.
A play-by-play Monte Carlo was the answer to that for one reason. One engine produces every market at once. A team total, a spread, a quarterback's passing yards and the correlation between all three come out of the same simulated drives, so the correlations are real instead of assumed. A same-game parlay is just the count of sims where every leg hit. There's nothing to patch because there's no step where a number gets multiplied by a feeling.
It is also, honestly, the harder way. A ratings model needs two numbers per team. This thing needs a model for whether the next play is a pass, who gets the ball, how many yards, whether the ball comes out, how much clock runs off, and whether the coach goes for it on fourth down, and it needs all of those to be right at the same time. That's the trade, and the rest of this post is about paying for it.
The Data, and What a "Prior" Is
Play-by-play comes from the cfbfastR data (362 columns per play). Teams, games, venues, rosters, coaches, SP+ and Elo come from the CFBD API. Pregame FPI comes from ESPN's predictor endpoint, captured days before kickoff so it's a fair benchmark later. Weather is Open-Meteo. Lines come from DraftKings and a few other books, with the opener and the close both kept.
Training runs on 2023 through 2025 only. The 2023 clock rule change took roughly five plays a game out of the sport, and a sim that targets current rules can't learn pace from a world that no longer exists. That's about 800 FBS-vs-FBS games a season, roughly 155 plays a game, close to a 50/50 pass-rush split.
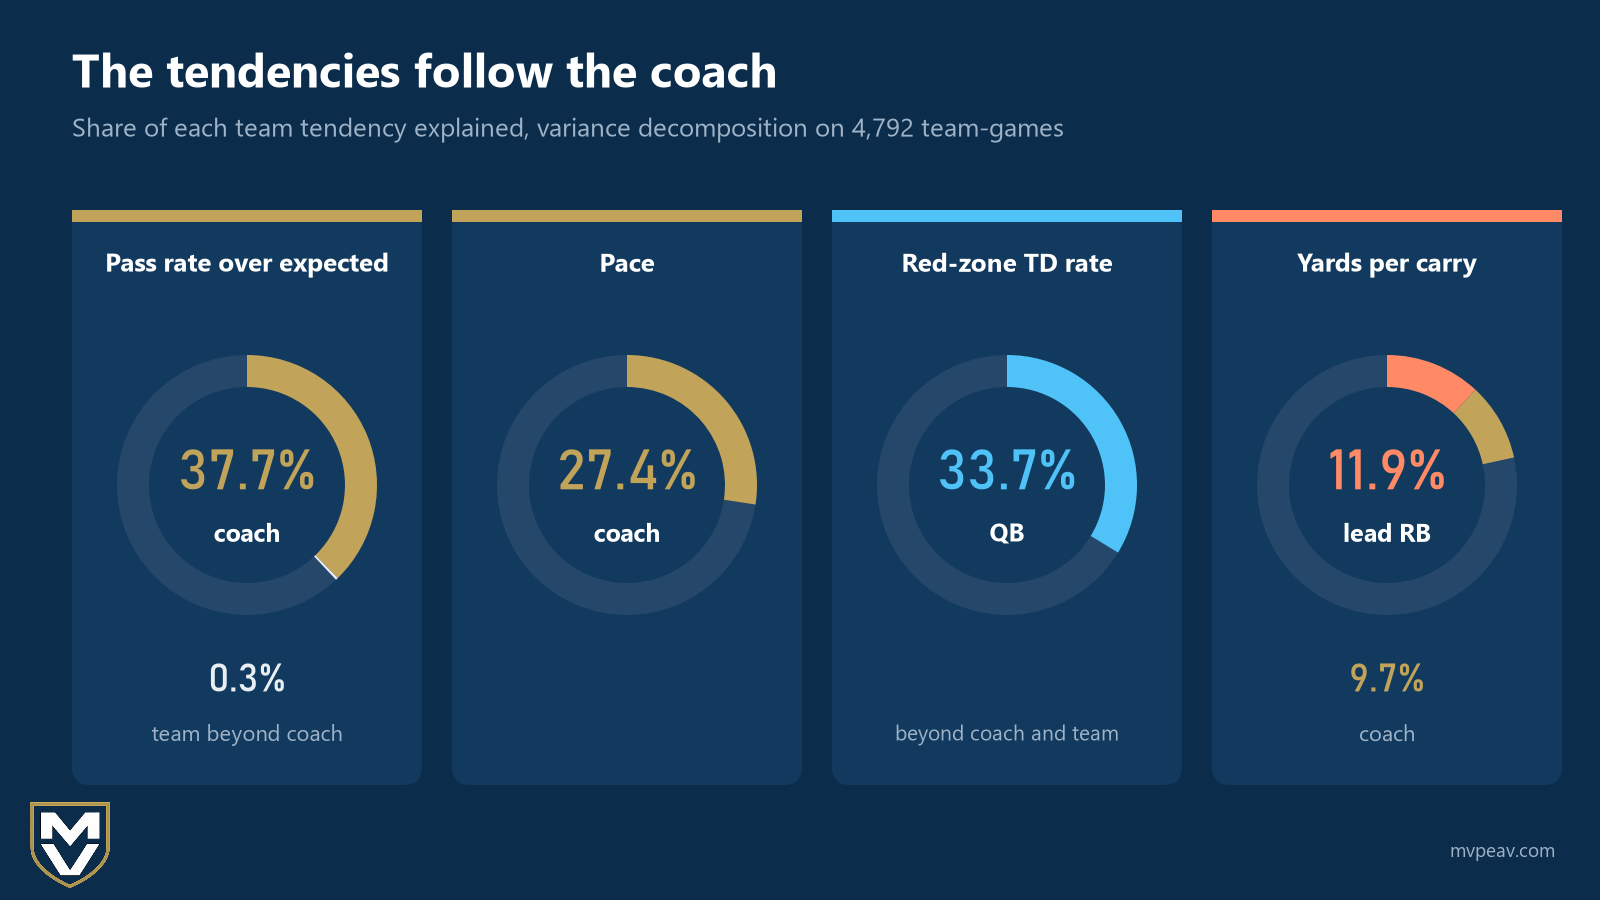
The priors are the part people ask about. Every team enters a game with a set of tendencies: pass rate over expected, pace, fourth-down aggressiveness, explosive-play rates on both sides, sack and turnover rates, red-zone finishing, and target and carry shares by situation. The question was what those tendencies should be keyed to, and I let the data answer it with a variance decomposition on 4,792 team-games. Pass rate over expected is 37.7% coach and 0.3% team beyond the coach. Pace is 27.4% coach. Red-zone touchdown rate is 33.7% quarterback, beyond coach and team, which was the big surprise. Yards per carry is 11.9% lead back and 9.7% coach. So the priors are coach-keyed with a quarterback layer, and a new coach at a program brings his tendencies with him instead of inheriting the old team's.
Every Monday a 22-step chain rebuilds all of it from the week's play-by-play: box scores, drive summaries, six rate lookups, pass rate over expected, pace, opponent-adjusted EPA ratings fit by ridge regression, player shares, running back and receiver priors, depth-chart shares. Season-to-date numbers are blended with the coach's career and the prior-season team using sample-size shrinkage, so week 3 doesn't overreact and week 10 doesn't underreact. Every lookup is keyed by season and week and loaded leak-safe, meaning a week 8 sim can only see what existed before week 8 kicked off. A hard leak check runs at the end of the chain. The whole rebuild takes under three minutes.
Two honest footnotes on inputs. Depth charts are a manual weekly inventory with overrides (week 9 had 19 quarterback changes and 29 players ruled out), and for receivers and backs the market's own ordering from posted props lines beats my depth builder, so that order is applied before the sim runs. And the opening spread is an input. It sits on the linear backbone of the yards and touchdown models as one feature among many. The sim is not market-free, and I'll come back to what that means when I grade it.
What Happens on One Snap
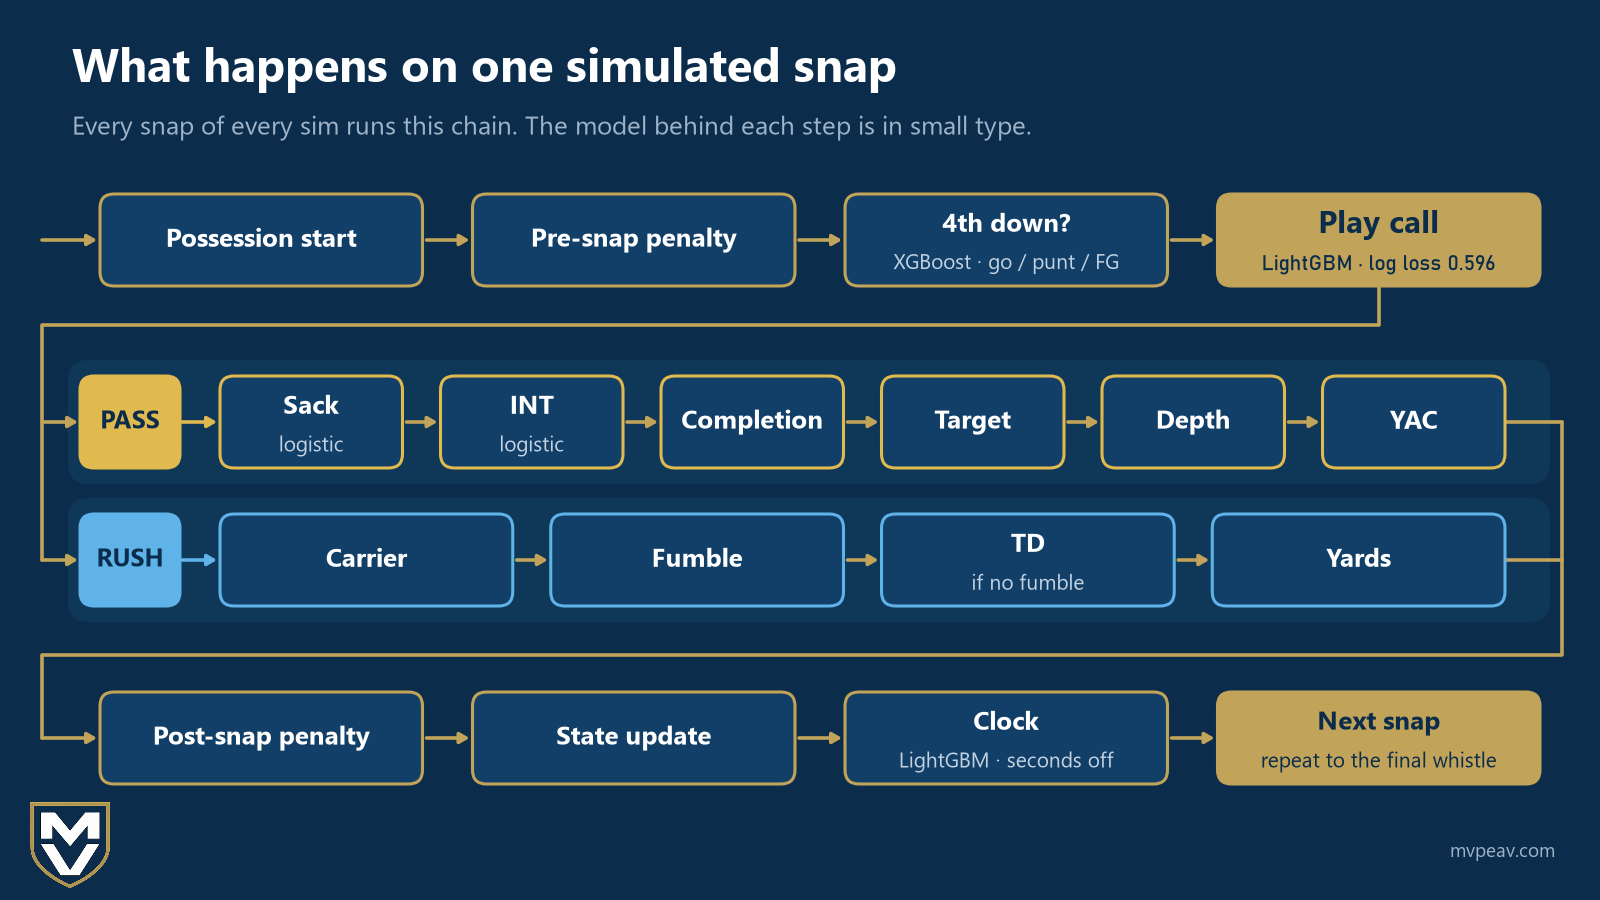
A possession starts. Pre-snap penalty check. If it's fourth down, a three-class model decides go, punt or field goal. Then a play-call model draws pass or rush. A pass goes through a cascade: sack, then interception given no sack, then completion, then target, depth and yards after catch. A rush goes carrier, then fumble, then touchdown given no fumble, then yards. Post-snap penalty check, state update, and a clock model decides how many seconds come off before the next snap. Repeat until the game ends, with overtime handled inside the engine.
Some of the pieces, with the numbers that justify them:
The play-call model is a gradient-boosted classifier on 17 features: down, distance, field position, score, time, the two teams' EPA ratings, the coach's pass-rate and pace priors, the fourth-down prior, home, dome and wind. On the 2025 holdout its log loss is 0.596 against 0.646 for a plain logistic model. The engine draws a coin from that probability on every snap rather than taking the most likely call, which is what keeps a sim from calling the same play every time in the same spot.
The rush cascade exists because of a data fact. Because rushing touchdowns yards gained equal the yards to the goal line exactly, a single yards regression model gets wrecked. Splitting touchdown out first (that model's AUC is 0.926) and modeling yards only on non-scoring runs fixed it.
The yards models are the most iterated part of the engine, and they've gone through nine versions. The short history: integer yardage classes, then a monotone ladder, then a factored "gate times body" design, then out-of-fold target encoding (which moved the rush calibration slope by 0.20, about six standard errors), then an explicit touchdown class for long plays. That last one mattered more than it sounds. Before it, touchdowns of 81 yards or more were structurally zero in the sim, zero in 2,087 snaps, and the chance of a score on a drive that never reached the 20 was 7.6% against 11.4% in real life. The explicit touchdown head took the official 654-game bias on totals from minus 5.13 points to minus 1.19.
Fourth down is a three-class boosted model with log loss 0.271 and 88.9% accuracy. Adding special-teams or quarterback priors to it made it worse, so they're not in it. The kicker model is a logistic on distance alone, because wind, altitude, surface and a kicker prior didn't improve it (wind on field-goal percentage tested at p = 0.86). Punts and kickoffs sample from measured outcome pools instead of a normal distribution with a guessed standard deviation, which is what the old model did. The two-point conversion rate is the measured 43.6%.
The clock model predicts seconds to the next snap with a root mean squared error of 10.9 seconds, with a recency half-life of a season and a half because pace drifts about a second a season and an incomplete pass went from 14.4 seconds to 10.1 between 2023 and 2025. Penalties, timeouts and two-point tries are always on. The rule in the project notes says it better than I can: without those, you're simulating something that is almost football but not quite football.
And one bug that belongs in here because it's the kind of thing that hides in a Monte Carlo. For a while every game under a given seed shared one random stream, so a seed that was "lucky" for the home team was lucky in every game that week, and the spread of seed means was 12 points when it should have been about one. Each game gets its own stream per seed now.
How Decisions Get Made: The Bake-Offs
Nothing goes into the served engine on taste. Every change is a bake-off on a fixed frame (models fit on 2023 and 2024, graded on 2025 weeks 3 to 14, 654 games, at least 48 seeds), with a bar set in advance, and a ledger of what won, what lost and what got reverted. A sample of the record:
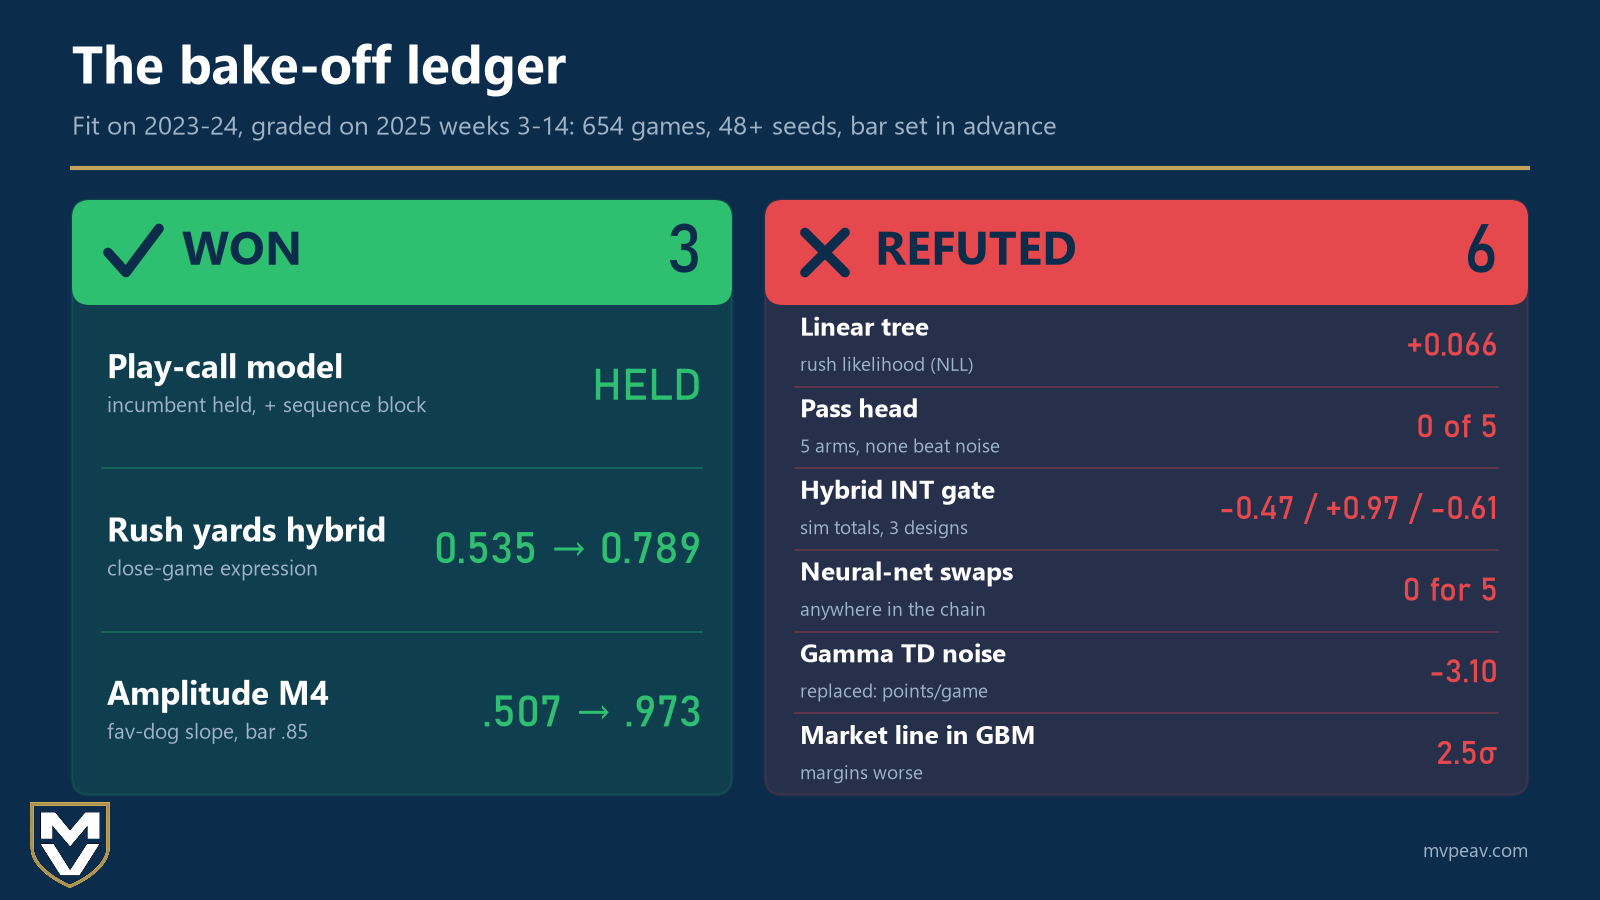
- Play-call class: gradient boosting versus a logistic and a neural net. The incumbent held; a sequence block (previous play, the drive's pass share so far) was added.
- Rush yards head: a hybrid of a linear backbone with a boosted residual won. It matched the baseline on likelihood and lifted the expression of close-game margins from 0.535 to 0.789. A "linear tree" variant was refuted (likelihood 0.066 worse). A neural net was rejected for distorting levels.
- Pass head: five arms, none beat the noise floor. Refuted, incumbent kept.
- Interception gate: a hybrid version won every offline calibration table and then moved simulated totals the wrong way in all three designs tried. Disqualified. Offline wins don't count if the game output gets worse.
- Neural-net swaps anywhere in the chain: 0 for 5.
- Touchdown noise: a gamma distribution clipped and cut 3.1 points a game off totals; replaced with a Gaussian in logit space, which cut the week-5 under-bias from 2.5 points to 1.6.
- Amplitude: the sim was under-separating favorites from underdogs. Three arms were tried; the per-play favorite-dog slope went from 0.507 to 0.973 against a bar of 0.85, and the 2025 favorite shortfall went from minus 2.68 points to minus 1.40. That arm is the production engine.
- Market line as a feature inside the boosted models: not adopted, margins 2.5 standard deviations worse. It lives on the linear backbone instead, where it behaves.
The Backtest That Was Too Good
Every modeler has this story and most of them don't tell it. The first full-season backtest of this engine came back plus 32.2% against the spread, plus 15.0% on totals, plus 5.1% on props, up 523 units on 5,698 bets. For about a day that was the headline.
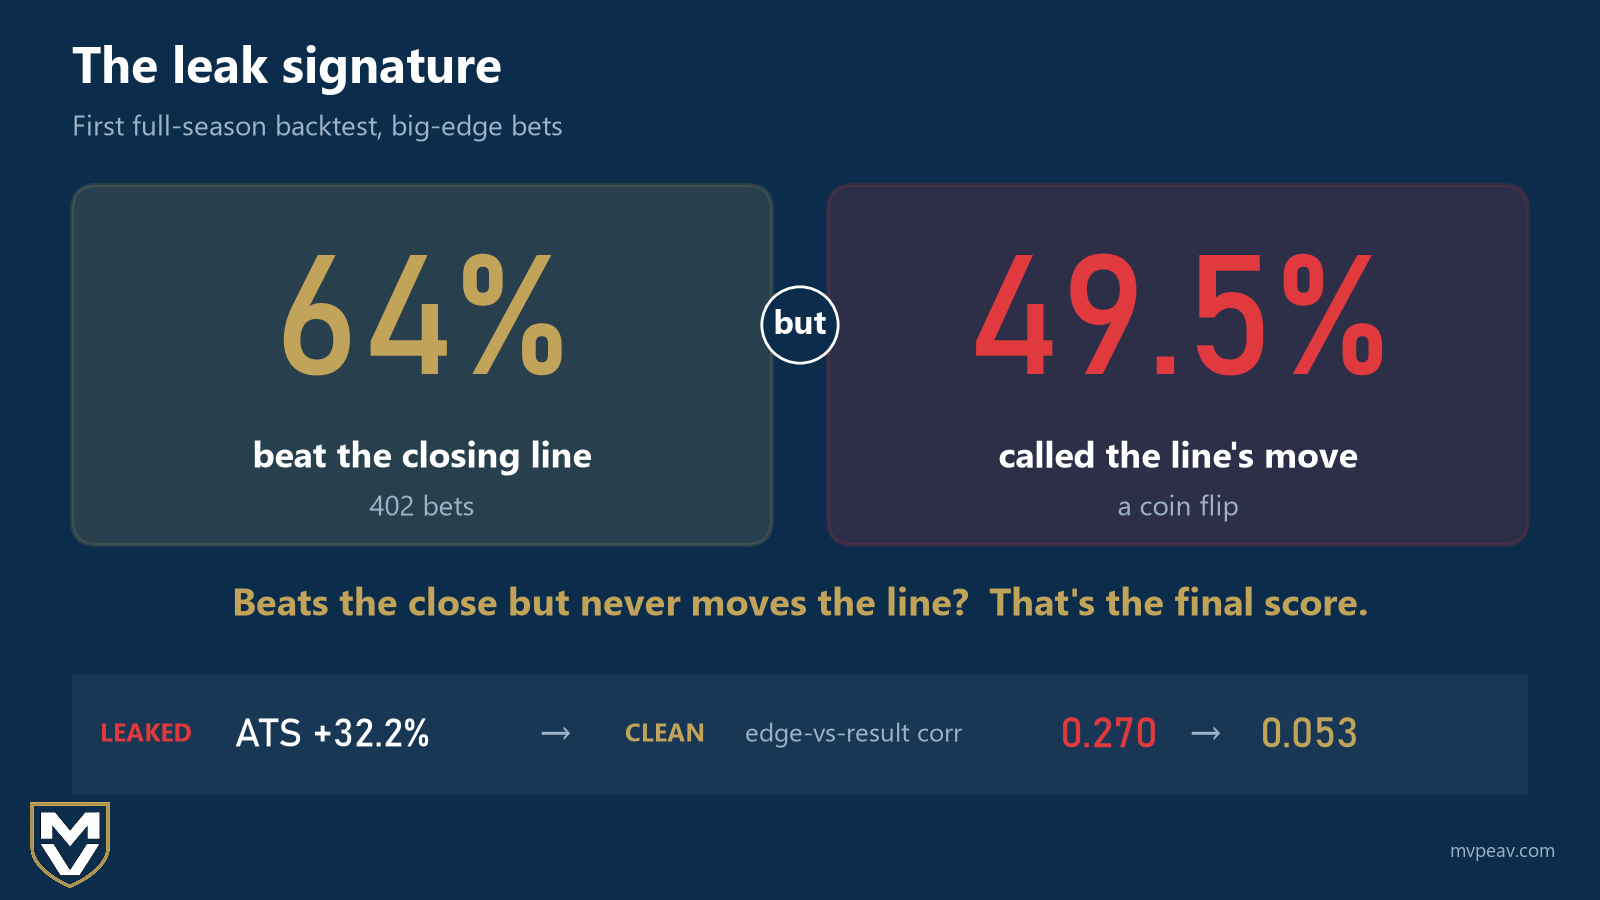
It was a leak. The FEI and Elo ratings used as "pregame" features were post-game versions. The correlation between a team's rating change and its own margin that same week was 0.71 for one source and 0.84 for the other, where an honest pregame rating sits around 0.04 to 0.08. What gave it away was a signature I now check for on everything: the sim beat the closing line 64% of the time on 402 large-edge bets while predicting the direction of line movement at 49.5%, a coin flip. Information that beats the close but doesn't reliably predict the line movement isn't trust worthy information.
With the leak out, the correlation between the sim's disagreement with the close and the actual result against the close dropped from 0.270 to 0.053, and the moneyline Brier score went from better than the market to worse (0.224 against the market's 0.186). That's the real starting point, and everything graded from here on is graded against the opening line, because that's the number that exists when the sim runs.
How It's Validated Now
The frame is walk-forward: fit on seasons before 2025, grade on 2025 weeks 3 to 14, 654 games, 48 seeds minimum, against verified finals and the opening line. The seed floor exists because 16-seed results aren't a measurement; a third of totals picks flip between two 8-seed halves.
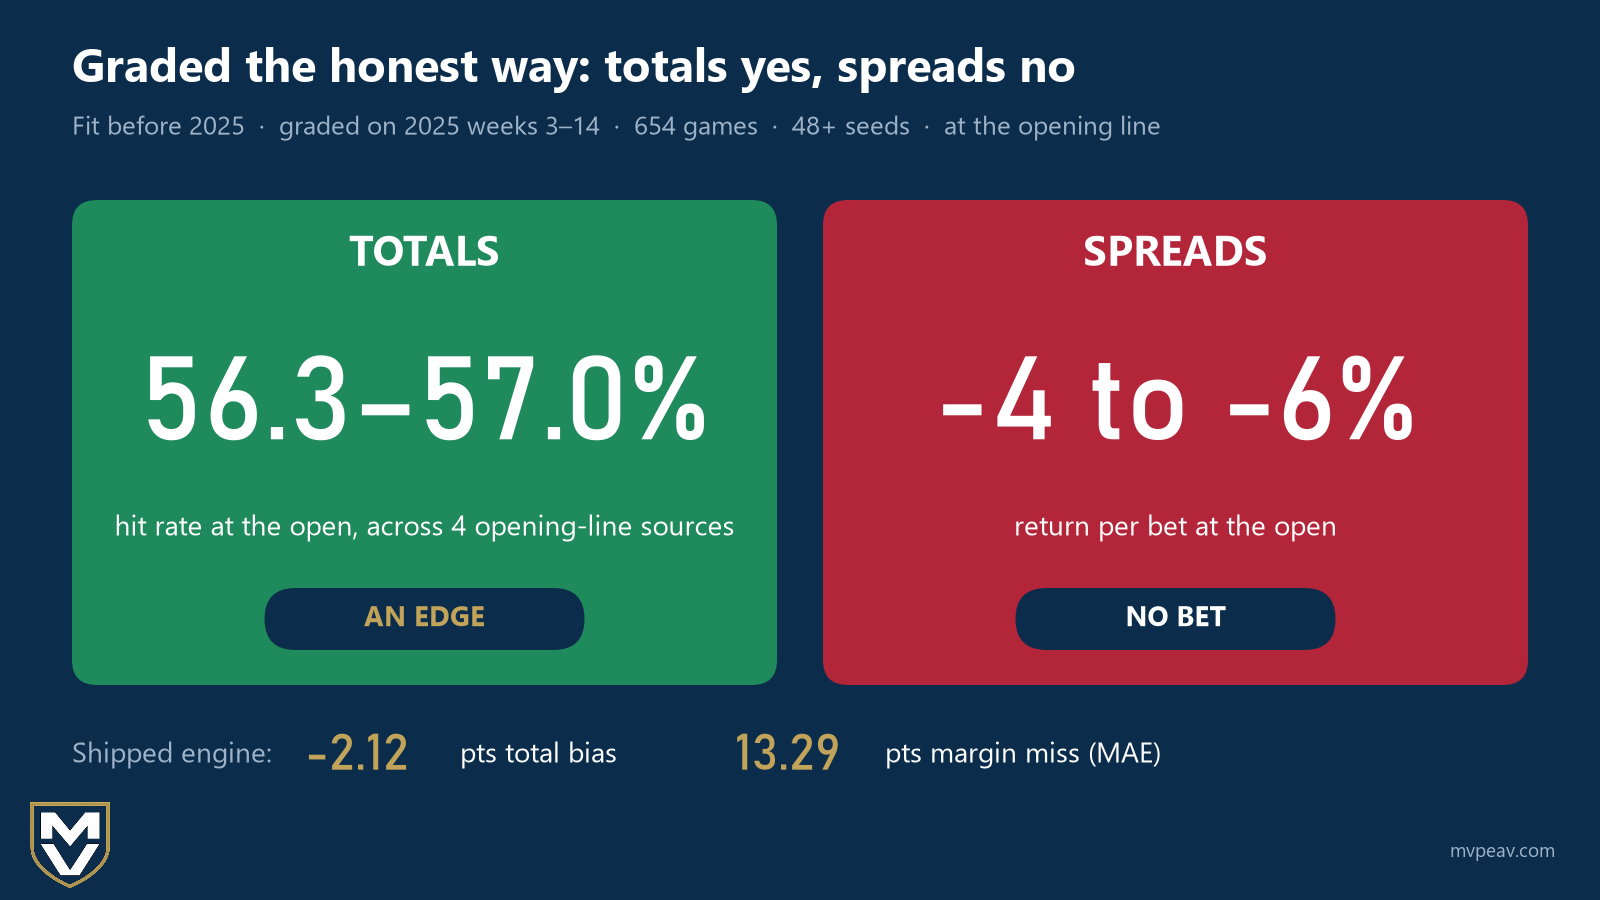
The shipped engine's record on that frame: total bias minus 2.12 points, margin mean absolute error 13.29. Totals at the open hit between 56.3% and 57.0% across four opening-line sources. Spreads were a no-bet, minus 4 to minus 6%.
A cleaner test of the same thing, run on the served recipe in September: on spreads the sim's side covered 51.3% of the time, plus or minus 2.1, with a slope of 0.088, meaning about 9% of the sim's disagreement with the spread was real and the rest noise. On totals, 56.0% plus or minus 2.1 with a slope of 0.382, and the edge concentrated in 3-to-6-point disagreements (59.8% on 179 games).
Two engineering checks sit under all of this. Seed convergence: across 200 seeds the margin's standard deviation is about 19 points, which puts the standard error of a 100-seed mean at 1.4 points, so 10,000 seeds in production is overkill by design. And a parity gate: before any cloud sweep runs (I sim on an AWS 196 core cloud box), two fixed games at three seeds are simulated and hashed, and the run only proceeds on a byte-identical hash against the reference machine. "Close enough" is never a script's call.
2026 Through Week 9: The Scorecard
This is the part that answers the question in the title. 449 games, weeks 2 through 9, the actual 10,000-sim run the site showed before each kickoff, graded against ESPN's pregame FPI on the same games.
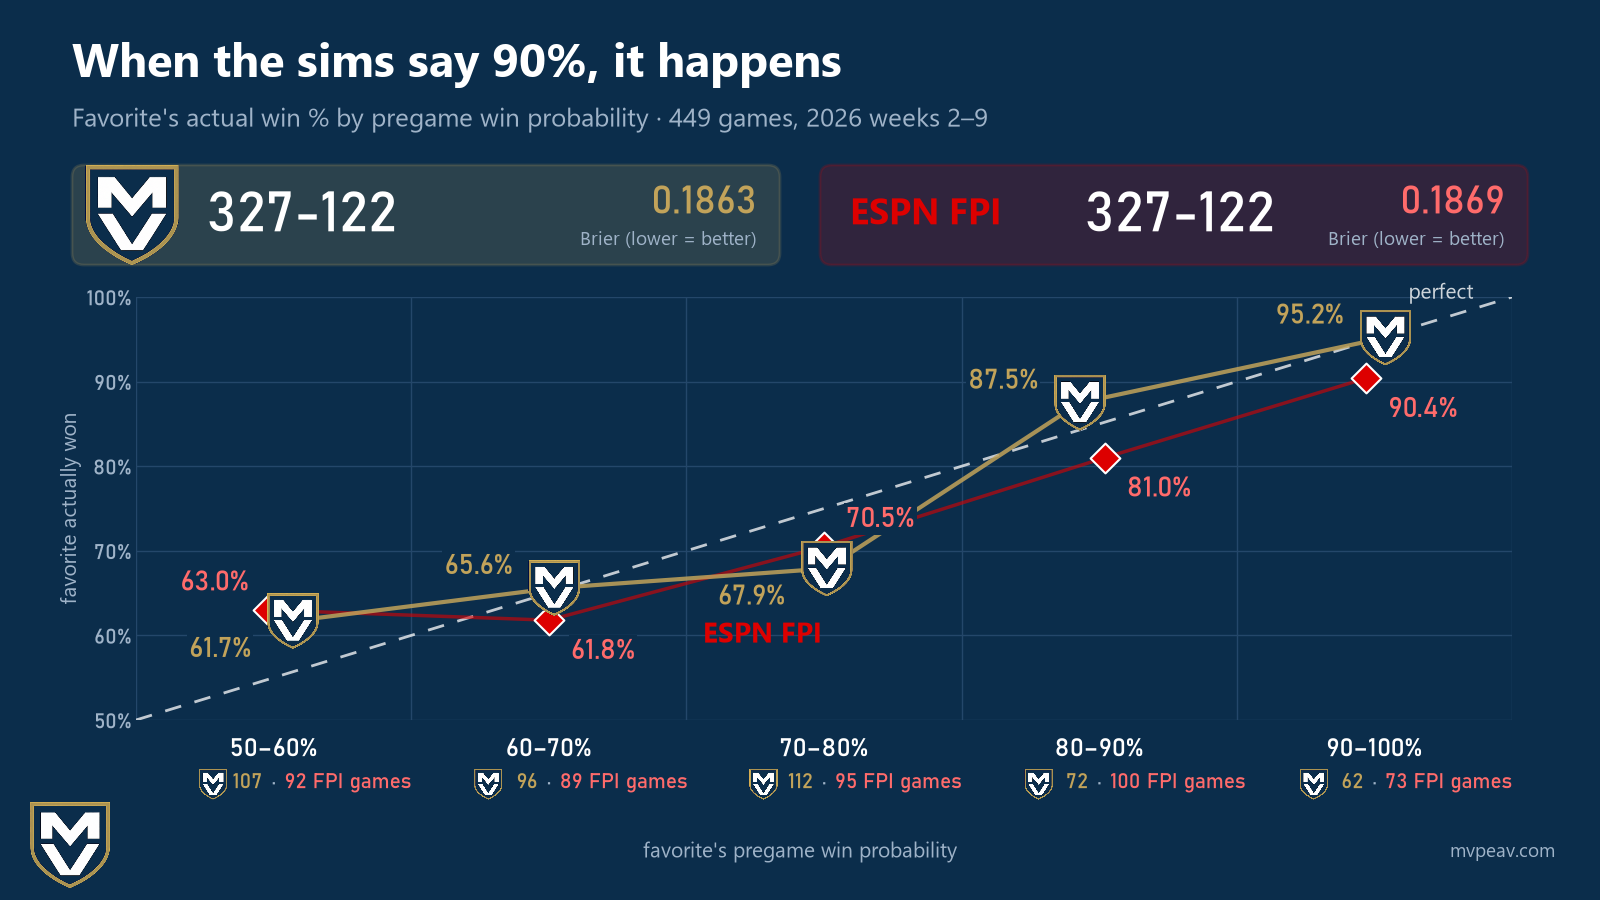
| Sims | ESPN FPI | |
|---|---|---|
| Straight up | 327-122 (72.8%) | 327-122 (72.8%) |
| Brier score (lower is better) | 0.1863 | 0.1869 |
| Mean margin miss | 12.2 | 11.8 |
| When they disagreed on the winner (50 games) | 25 | 25 |
Dead even, in other words. The same record on the same games, with the probability quality a hair better and the point estimate a hair worse. The distributions are the thing a ratings model can't give you, and they hold: the sims' middle-50% margin range contained the actual margin 52.8% of the time and the middle-80% range 81.5%. A favorite the sims priced at 90 to 100% won 95.2% of the time; one priced at 80 to 90% won 87.5%; the 60 to 70% bucket won 65.6%. The one soft spot is the 70-to-80% bucket, which won 67.9% on 112 games, and the 50-to-60% bucket, where both the sims and FPI under-rated the favorite (61.7% and 63.0% actual). Week 3 was the best week (49-8); week 8 was the worst (37-19), and each week I do a week in review post showing the record so that anyone interested can see how the sim is doing (full transparency all the time has always been something I strive for).
Against the market, with the caveat from earlier that the sim takes the opener as an input:
| Raw sim median vs the line | vs the opener | vs the close |
|---|---|---|
| Spread | 219-205-9 (51.7%) | 202-226-8 (47.2%) |
| Total | 237-200 (54.2%) | 219-230 (48.8%) |
Mean absolute margin miss runs opener 11.6, sims 12.2, close 11.2. The closing line is the best predictor in the sport and the sim doesn't beat it; nothing public does on volume. On totals the sim's bigger disagreements have been right (44-29 when it sat 7 or more points off the close); on spreads they haven't (40-53 when it sat 6 or more off).
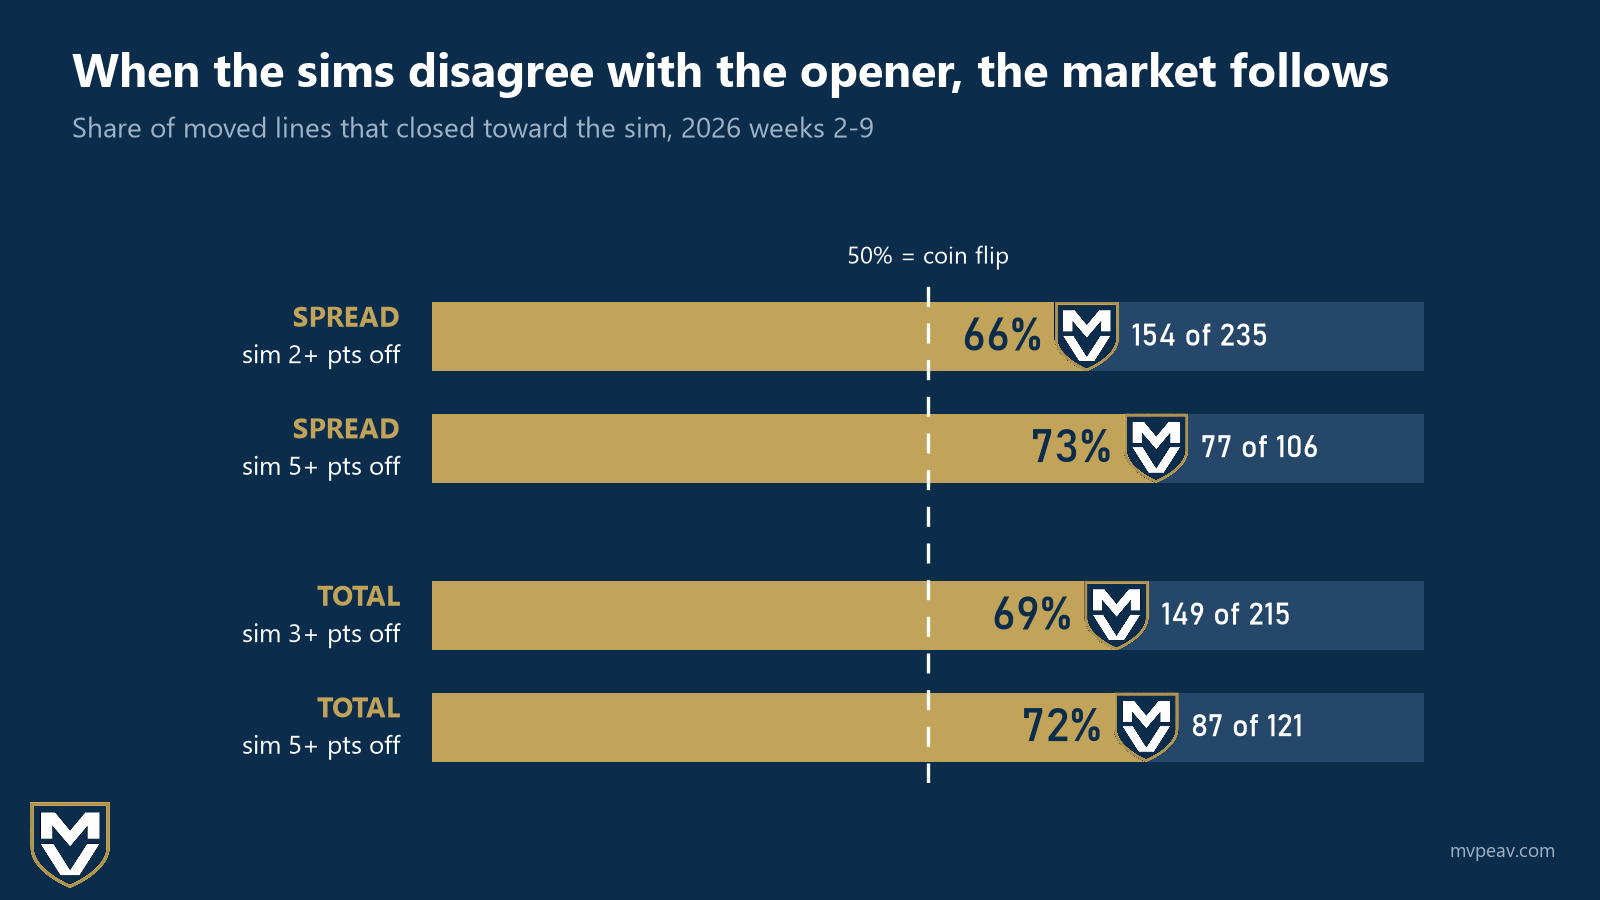
The number I'd put on the fridge when it comes to the spread tho, is this one. When the sim disagrees with the opening line, the market moves toward the sim before kickoff.
| Sim off the opener by | games | line moved | moved toward the sim |
|---|---|---|---|
| 2+ points (spread) | 278 | 235 | 66% |
| 5+ points (spread) | 126 | 106 | 73% |
| 3+ points (total) | 250 | 215 | 69% |
| 5+ points (total) | 144 | 121 | 72% |
That's the test that caught the leak, run the other way. A leaked model beats the close and doesn't move the line. This one moves the line and doesn't beat the close, which is what a real, modest, pregame signal looks like.
Player Props Against the Box Score
The props were the original reason this thing exists, so they get graded the same way: the staged 10,000-sim run before each kickoff against the actual box score, weeks 2 through 9. A projection counts when the sim gave the player a real role (15 pass attempts, 8 carries or 3 targets at the median) and the player actually had one in the game. That gate matters, and I'll come back to it.
| Stat | graded | mean abs miss (sim median) | season-average baseline on the same players | DK Exchange ladder on matched players |
|---|---|---|---|---|
| Passing yards | 691 | 63.9 | 64.8 | 57.9 (n=333, sim 61.8) |
| Receiving yards | 656 | 32.2 | 34.6 | 33.1 (n=257, sim 33.5) |
| Rushing yards | 361 | 38.3 | 38.4 | 38.3 (n=141, sim 43.1) |
| Receptions | 908 | 1.91 | 1.95 | |
| Completions | 695 | 4.74 | 4.80 |
Read that as it is. On receiving the sim is two points better than a player's own season average and within half a yard of the market's implied median. On passing it's a hair better than the naive number and about four yards worse than the market. On rushing it's no better than the naive average and five yards worse than the market. A play-by-play engine that models every carry should beat "what he's averaged so far," and on the rushing it doesn't yet so that will definitely prompt more investigation.
The count stats are better behaved when you use the sim's mean instead of its median, which is the right point estimate for a 0-1-2 stat. Passing touchdowns: sim 1.49 a game against an actual 1.49 on 713 quarterback games. Rushing touchdowns run light by about 0.20 a game and receiving touchdowns by 0.08; interceptions run heavy by 0.23 (the sim throws 0.87 picks a game to the real 0.64).
The widths are where the model-level problem shows. The sims' middle 50% (the 25th to 75th percentile) contained the actual passing yards 40% of the time, rushing yards 43%, receiving yards 48%, when a calibrated distribution would say 50%. The 10th-to-90th band held 71%, 69% and 77% against a target of 80%. The misses pile up in the tails in a specific way: 17% of passing-yard actuals landed below the sim's 10th percentile (quarterbacks pulled in blowouts, or benched), and 21% of rushing-yard actuals landed above the 90th (the back who got fed). The per-player distributions are too narrow, and the audit that found it last August said the missing variance is usage, not efficiency: the sim decides how many touches a player gets almost deterministically from his share prior, when the real game-to-game spread of touches is much wider.
Splitting each miss into touches and yards per touch says where the width goes. Rushing is a usage problem: the sim's yards per carry is nearly right (5.17 against 5.26 real) but it hands a back 12.2 carries when he gets 15.7, and when the carries land within three of the sim's number the rushing-yard miss drops from 38.3 to 27.6 with the bias almost gone. Passing and receiving are the other way: attempts and targets are close (31.4 vs 29.8 attempts, 7.8 vs 7.2 targets), and the sim is light per touch, 7.21 yards per attempt against 7.52 and 7.60 yards per target against 9.38. The engine under-feeds the lead back and under-pays the completed pass.
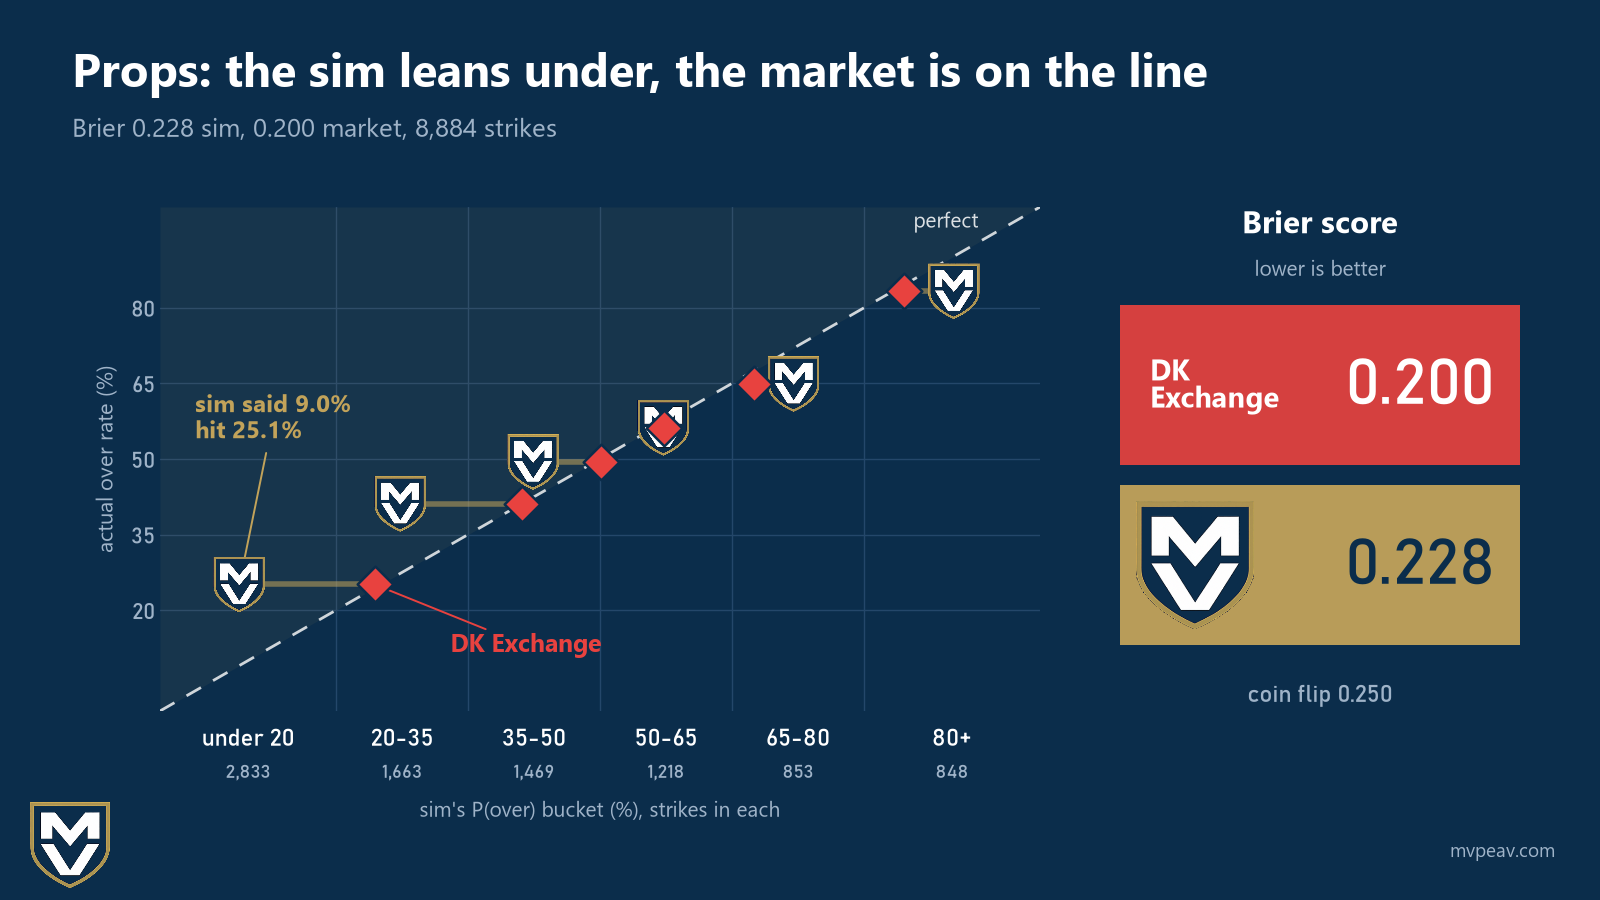
The probability view is harsher than the yardage view, and it's the one that matters for a prop. Every DK Exchange strike that traded before kickoff (8,884 of them on players who had a real workload, weeks 2 through 9) gets the sim's probability of the over, the market's last pre-kick price, and what happened:
| Sim's P(over) bucket | markets | sim said | market said | actual over rate |
|---|---|---|---|---|
| under 20% | 2,833 | 9.0% | 24.4% | 25.1% |
| 20 to 35% | 1,663 | 27.3% | 41.1% | 41.1% |
| 35 to 50% | 1,469 | 42.4% | 50.1% | 49.4% |
| 50 to 65% | 1,218 | 57.2% | 57.3% | 56.2% |
| 65 to 80% | 853 | 72.0% | 67.5% | 64.9% |
| 80% and up | 848 | 90.2% | 84.6% | 83.3% |
Two things are in that table. The market is calibrated almost to the point: in every bucket its price and the actual over rate sit within a point or two. The sim is overconfident at both ends and, more than that, it leans under. When it prices an over at 9% the over hits 25%. When it prices one at 90% it hits 83%. Read by the market's buckets instead, the sim's number sits 4 to 11 points below the market's in every bucket, and the market is the one that's right. That's the per-touch shortfall from the paragraph above showing up as a probability: an engine that pays 7.21 yards an attempt when the real number is 7.52 will price too many unders, which is exactly the disease the first version of this project died of, at a much smaller dose.
The Brier score says the same thing without the table: sim 0.228, market 0.200, a coin flip 0.250. Blending the sim into the market price doesn't help at any weight; the best mix is the market alone. Where the two disagree by 15 points or more, the sim's side hits 51% on passing yards, 52% on receiving yards, 49% on rushing yards and 41% on passing touchdowns. On player props this season, the sim adds nothing to the market price, and it says so in its own numbers.
So the honest summary on props: the engine's yardage distributions have about the right center and the wrong width, it prices too many unders, it has no edge on the market's own probabilities, and the availability problem is bigger than the modeling problem. The totals edge in the game-level backtest doesn't carry down to the player level but that just means that I have a little more work to do this off season
What's Still Wrong
Spreads carry no edge. The side-cover test says it, the backtest says it, and eight weeks of 2026 say it. Early-season inputs are stale carries, and the engine's margin slope in week 1 is about 0.5 against 0.83 in season. Props have a structural problem the backtest can't fully price: a player who ends up not playing still had projected touches in the sim, about 17% of predicted touch mass at the pessimistic bound. The clock model runs about six plays a game light from tree mean-regression, and the rule against patching says I can't fix that with a constant.
The Wrap up
We've covered a lot of ground and honestly this article was as much to get my methodology on paper for my own good as it was for anyone else's but hopefully someone else also found my nerding out enjoyable. Would love to hear anyone else's thoughts or suggestions on my work, always enjoy learning new things from people who know more than me since I am incredibly far away from being an expert at these things.