CFB · SCORECARD · SIMS · SIMULATIONS · ESPN-FPI · WEEK-7
Sims Go 41-18 in Week 7, Beat FPI by Three Games, and Still Got Torched by Charlotte
By MVPeav · @MVPeav ·
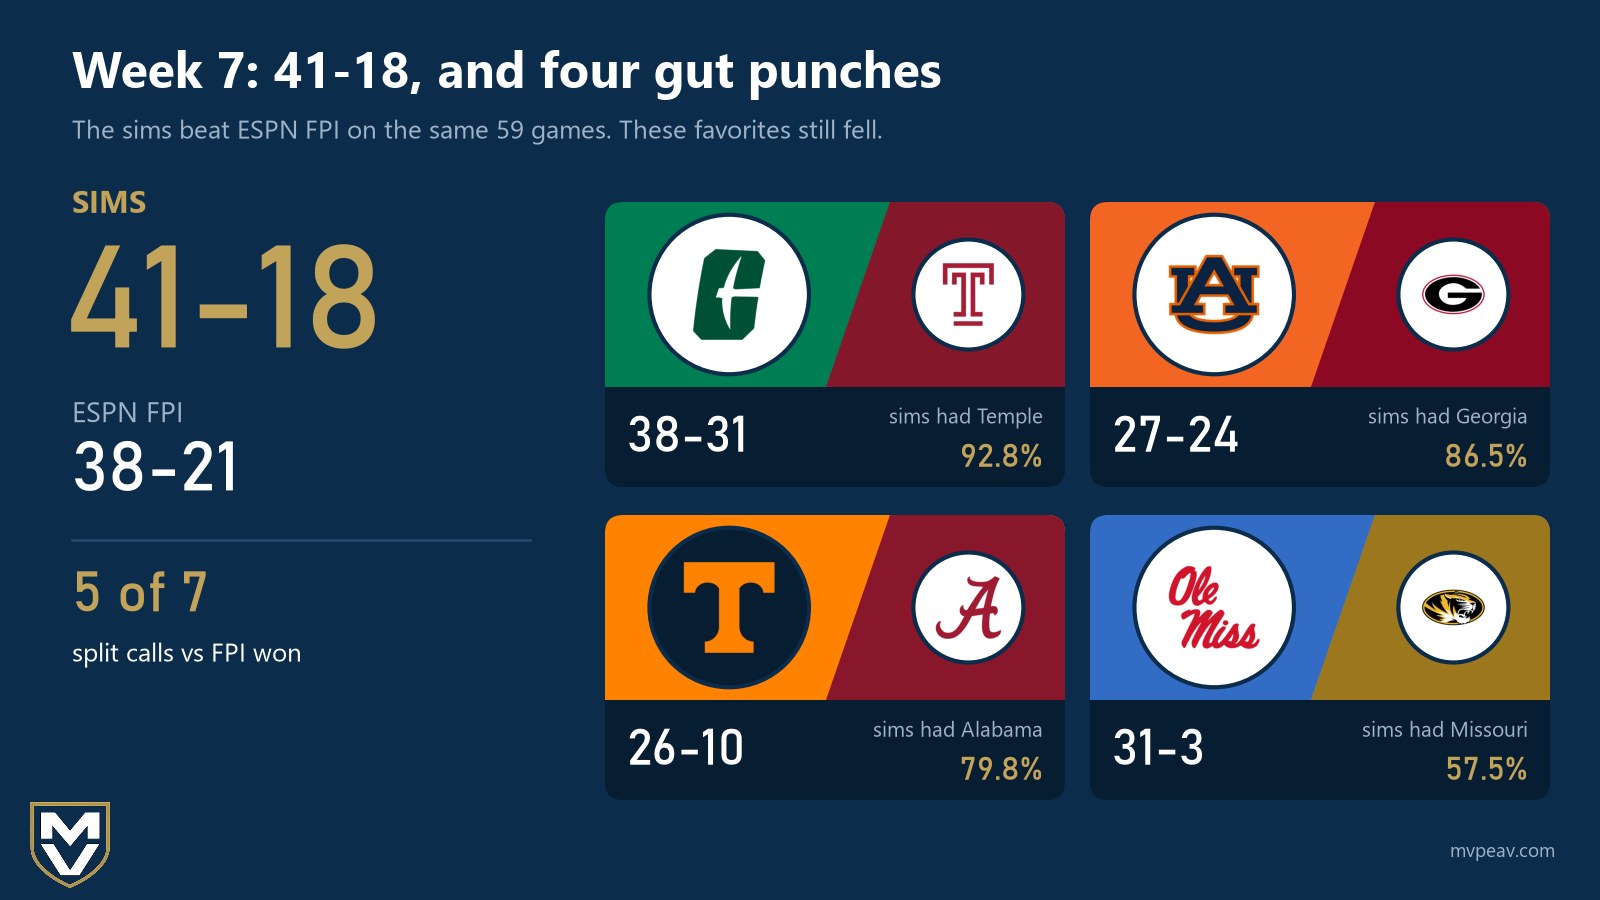
The sims went 41-18 in week 7. That's 69.5%, which is a C-plus, and it beat ESPN's FPI by three games on the exact same slate.
So I get to brag and eat crow in the same column. The season is basically a dead heat with the Worldwide Leader, the misses were almost all teams falling apart on their own, and one of them was a 92.8% Temple favorite losing to a Charlotte team that hadn't won a game in 15 tries.
Let's grade it.
41-18, and Somehow That Beat the Worldwide Leader
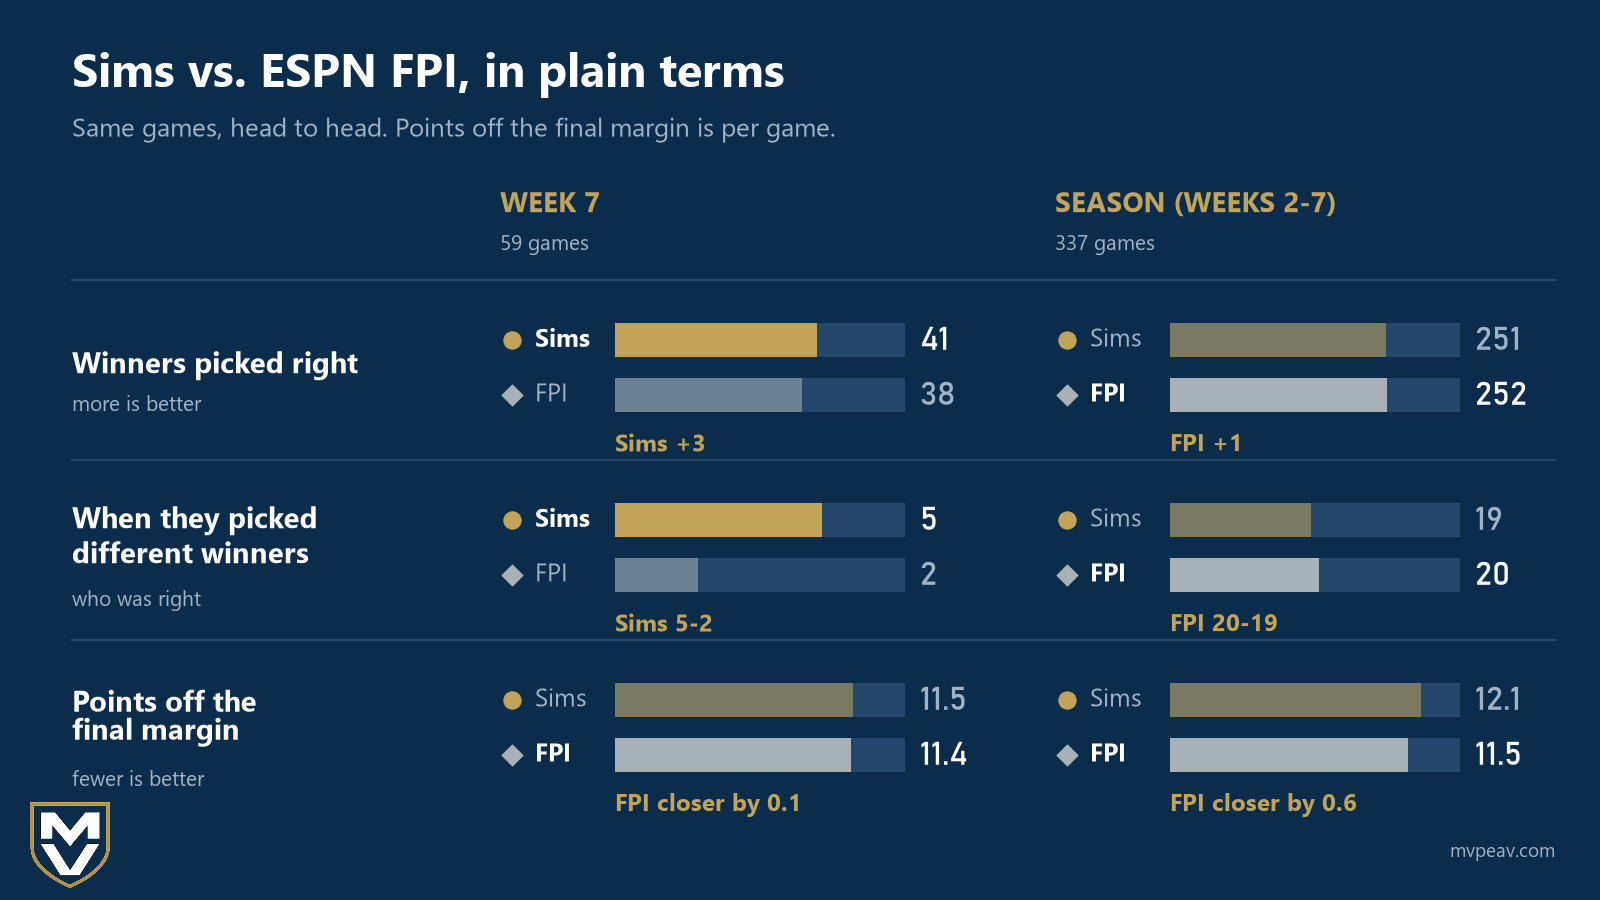
The sims called the winner in 41 of 59 games. FPI, on those same 59, went 38-21. Same games, same weekend, three games better.
It wasn't just the win-loss count either. The Brier score (think of it as a calibration number for how well our win% translated to actual win%, with the lower Brier score the better) came in at 0.2279 for the sims and 0.2312 for FPI. Small edge, but real edge.
Margins were a wash. The sims missed the final margin by 11.5 points on average, FPI by 11.4. For scale, 11.5 is a touchdown and a field goal with change left over, and it's an average, so the perfect calls count as 0 and the blowups count big. SMU by 10 in my sims, SMU by 10 on the field, that's a 0. Temple by 23 in my sims, Charlotte by 7 on the field, that's a 30-point miss, and a few of those is all it takes to get you to 11.5. Our season number is 12.1, so this week was a touch better than normal for us, and right about where FPI lives all year.
The ranges did their job tho. When my sims say the middle 50% of outcomes lands in a certain window, the real margin should land there about half the time. In week 7 it landed there 52.5% of the time, and the wider middle-80 window caught 84.7%. On the season those sit at 55.2% and 81.6%. That's about as on-target as you can ask.
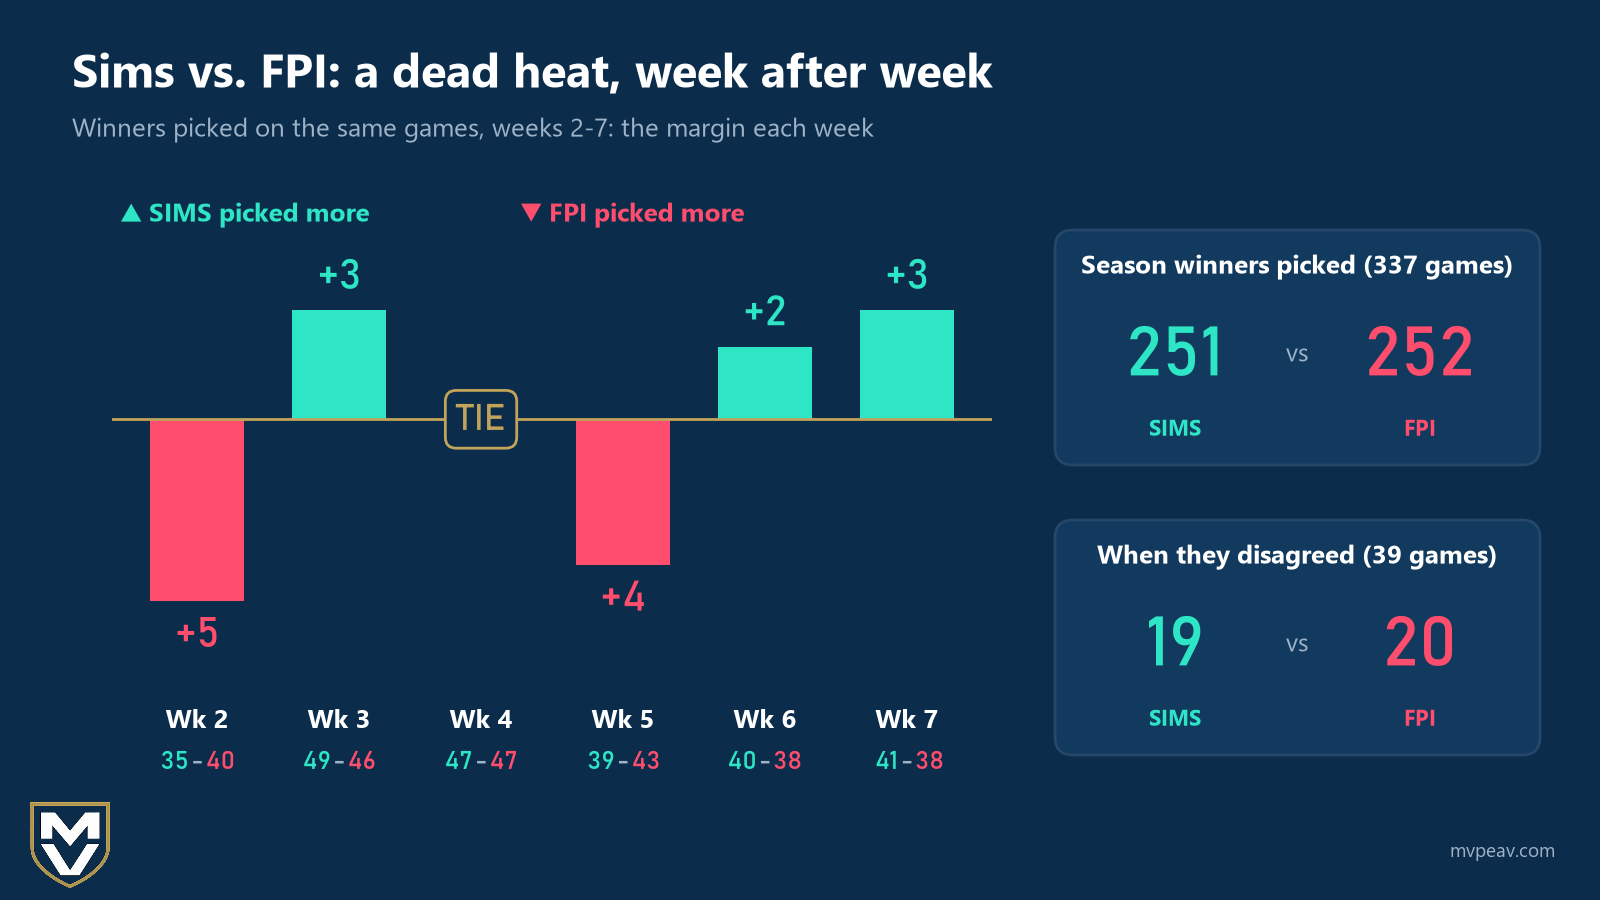
Now the part FPI gets to brag about. Weeks 2 through 7, the sims are 251-86 straight up, 74.5%. FPI on the same games is 252-85. One game. Season Brier is 0.1779 for the sims against 0.1771 for FPI, and FPI's margin miss is 11.5 to our 12.1. So they're a hair ahead on the year, I'm a hair ahead this week, but comparing my one man show to the Goliath that is ESPN, I don't mind being David.
The Calls We'll Be Bragging About
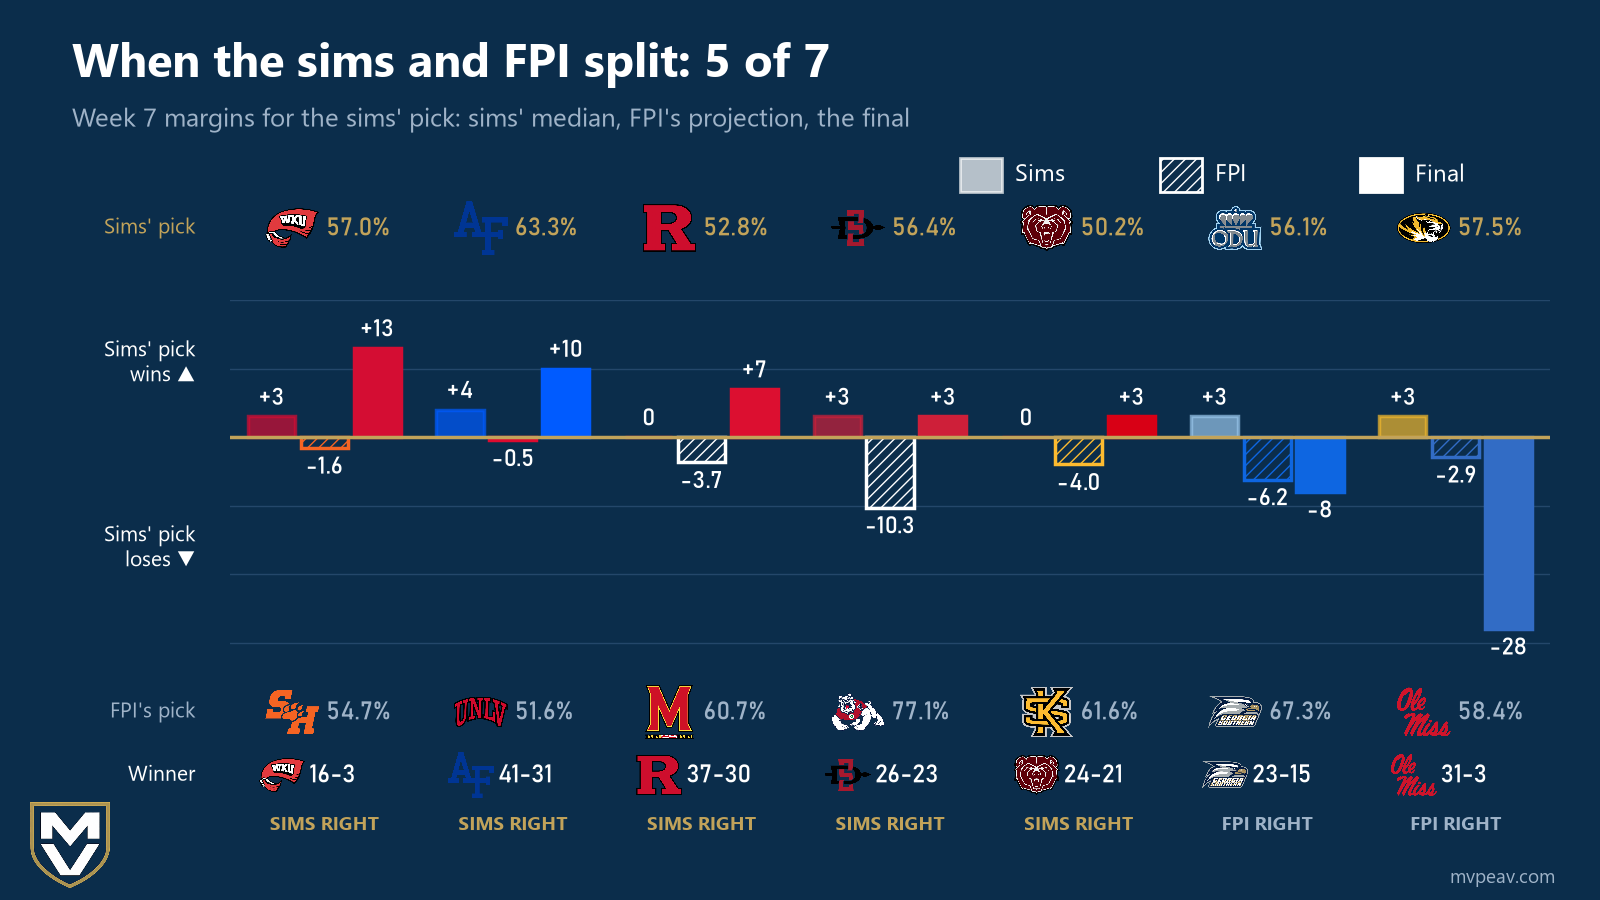
Where it gets fun is the disagreements. In 7 games this week the sims and FPI had different winners, the sims were right in 5 of 7. That's the part I actually care about, because agreeing with FPI on Ohio State over Purdue proves nothing.
Then the exact hits. Out of 1,251 graded predictions, the sims put SMU by 10 over Virginia and it finished SMU by 10. They had Ohio State by 4 over Indiana and Ohio State won 19-15. Dead on, twice, in two games where the sims only had Ohio State at 60%.
Player stat predictions also had a good week. Mensah's 23 completions matched the median exactly. MacIntyre's passing yards came in at 195 projected, 197 actual. Two yards. I'll take that any week (although I wish it hadn't happened again the Tide).
And the weird one: the sims had Auburn-Georgia at 51 total points, and the game finished 27-24. Fifty-one. Got the total perfect and the winner and margin completely wrong, which is the most simulator thing that has ever happened.
Utah over Colorado 27-24 landed on the right side at 89.7%, a close call the sims liked a lot and got.
Charlotte 38, Our 92.8% Favorite 31
Worst miss of the week, no contest. The sims gave Temple 92.8% with a median score of Temple 33, Charlotte 10. Three-touchdown favorite. Charlotte won 38-31.
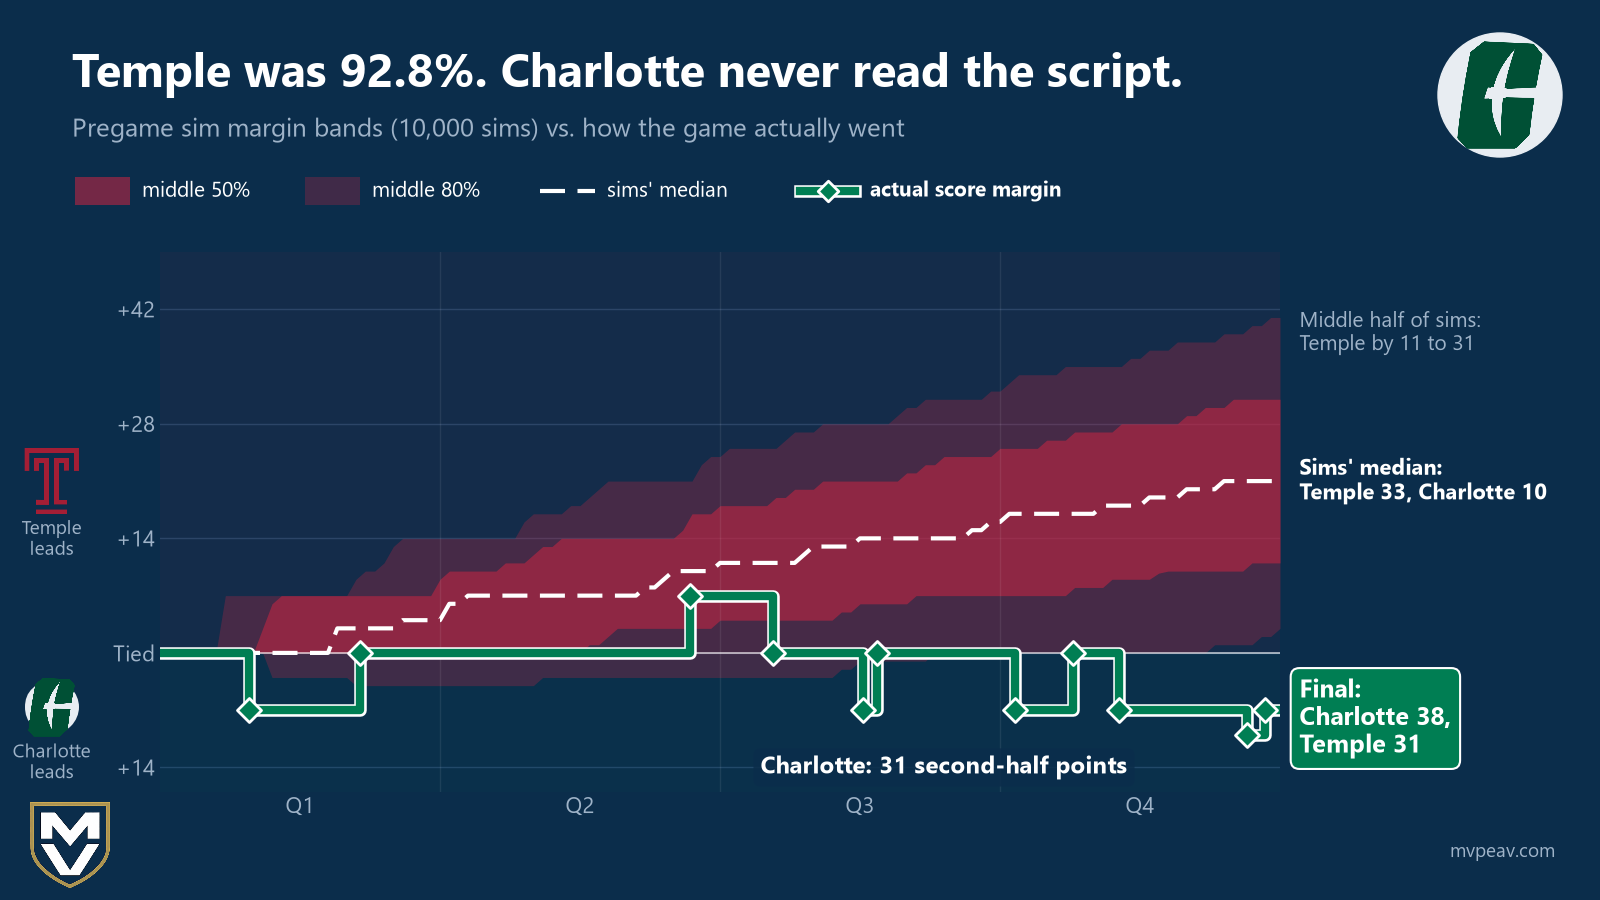
Charlotte came in on a 15-game losing streak. Conner Harrell went 23-of-31 for 281 yards and ran for two touchdowns, the 49ers scored 31 points in the second half alone, and they put up 449 yards. That's a team getting run off its own field so not just a flukey bounce.
FPI had Temple at 92.3%, so this isn't a case where the sims saw something dumb that everybody else avoided. Everybody was wrong. That doesn't make it less wrong but I don't mind hiding in the crowd on this one
My honest reaction: if the simulator had predicted a Charlotte win, I would have started open heart surgery on it to find where it went off the rails. There was no version of the inputs that produced that. So I'm happy for the 49ers, genuinely, because they found a way to make it in in the 7.2%.
The fair counterpoint is that a 7.2% outcome shouldn't look like 449 yards and a 31-point half. It should look like a lucky field goal. The sims will see that Charlotte tape, and so will I.
When the Big Boys Fall Apart, the Sims Fall With Them
The rest of the misses had a theme, and the theme was favorites beating themselves.
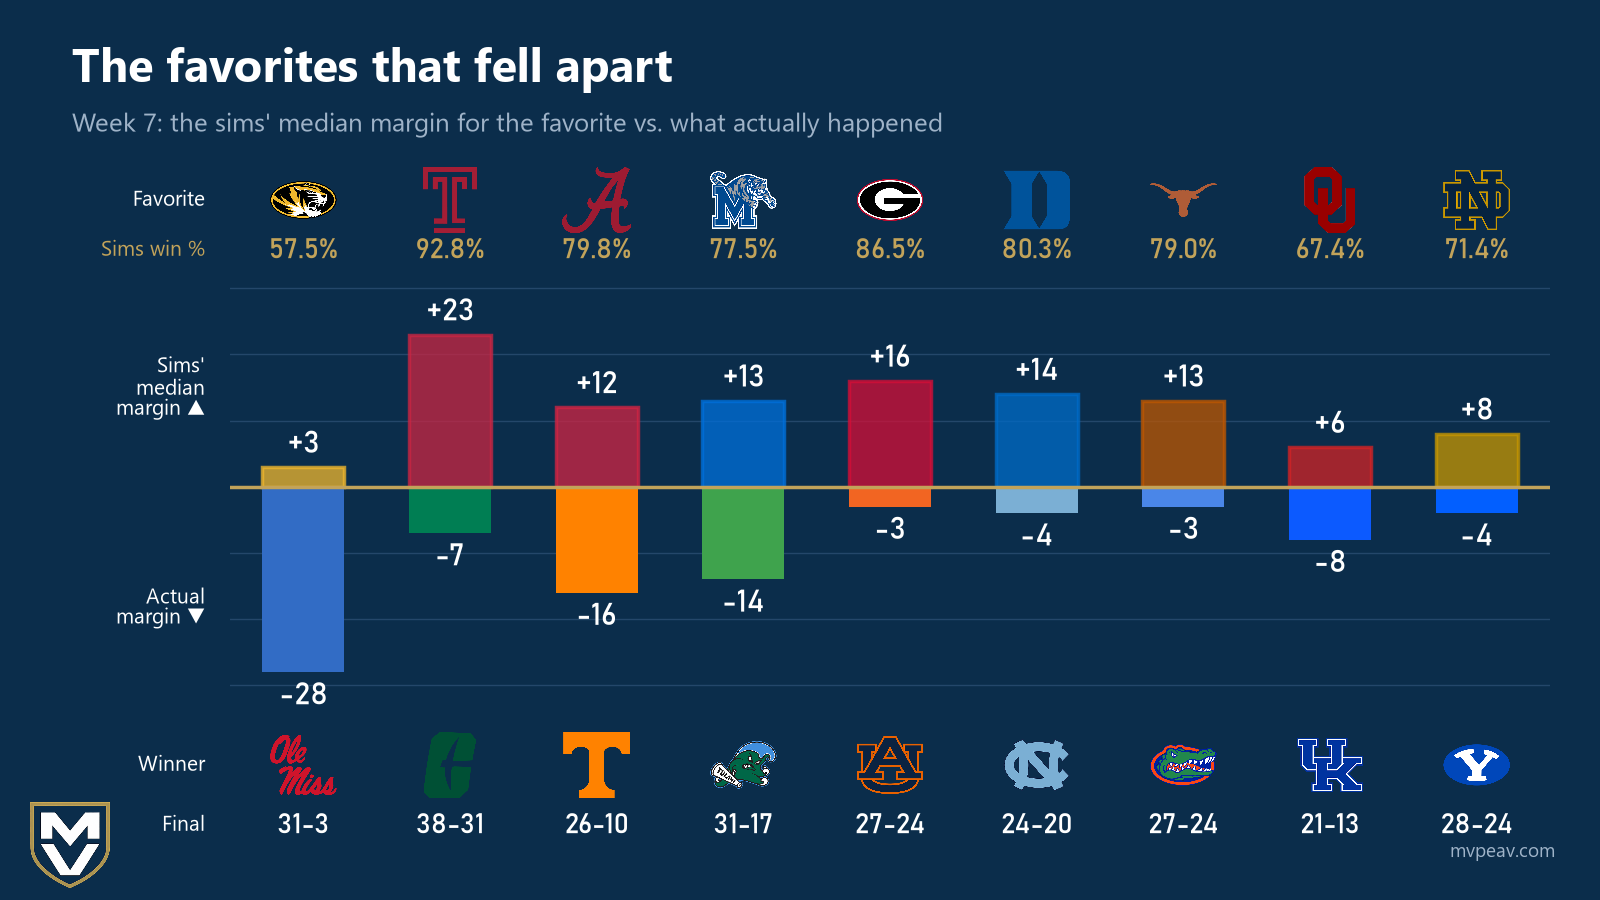
Georgia. The sims had the No. 1 team at 86.5% at home against Auburn (FPI said 90.3%), and Auburn won 27-24 on a walk-off field goal. Georgia threw two interceptions, fumbled with 58 seconds left, and took three personal fouls. Auburn got outrushed early, trailed 14-0, then finished with a 192-113 edge on the ground. No simulator in the world has a "Georgia commits three personal fouls" and turns the ball over late setting.
Alabama. Sims had Bama at 79.8% with a median of 31-19. Tennessee won 26-10. Alabama finished with 201 total yards, 54 of them rushing, turned it over four times (two picks, two fumbles) and went 2 of 13 on third down. DeSean Bishop carried 32 times for 159 and two scores. That's the first back-to-back regular-season losses for Alabama since 2007, and as someone who lives on that side of the fence, I don't need a stat to tell me how that felt. FPI had Alabama at 71.2%, so it was less wrong, but it was still wrong.
Missouri. This was the biggest whiff by magnitude. Sims leaned Missouri 57.5% with a median of 30-27, FPI leaned Ole Miss 58.4%, and Ole Miss won 31-3. Score one for FPI (more than Missouri scored in the final 53 minutes). Jamal Roberts, who had gone over 200 rushing yards in each of his previous two games, got 39 yards on 20 carries. Ole Miss ran for 257 and totaled 498.
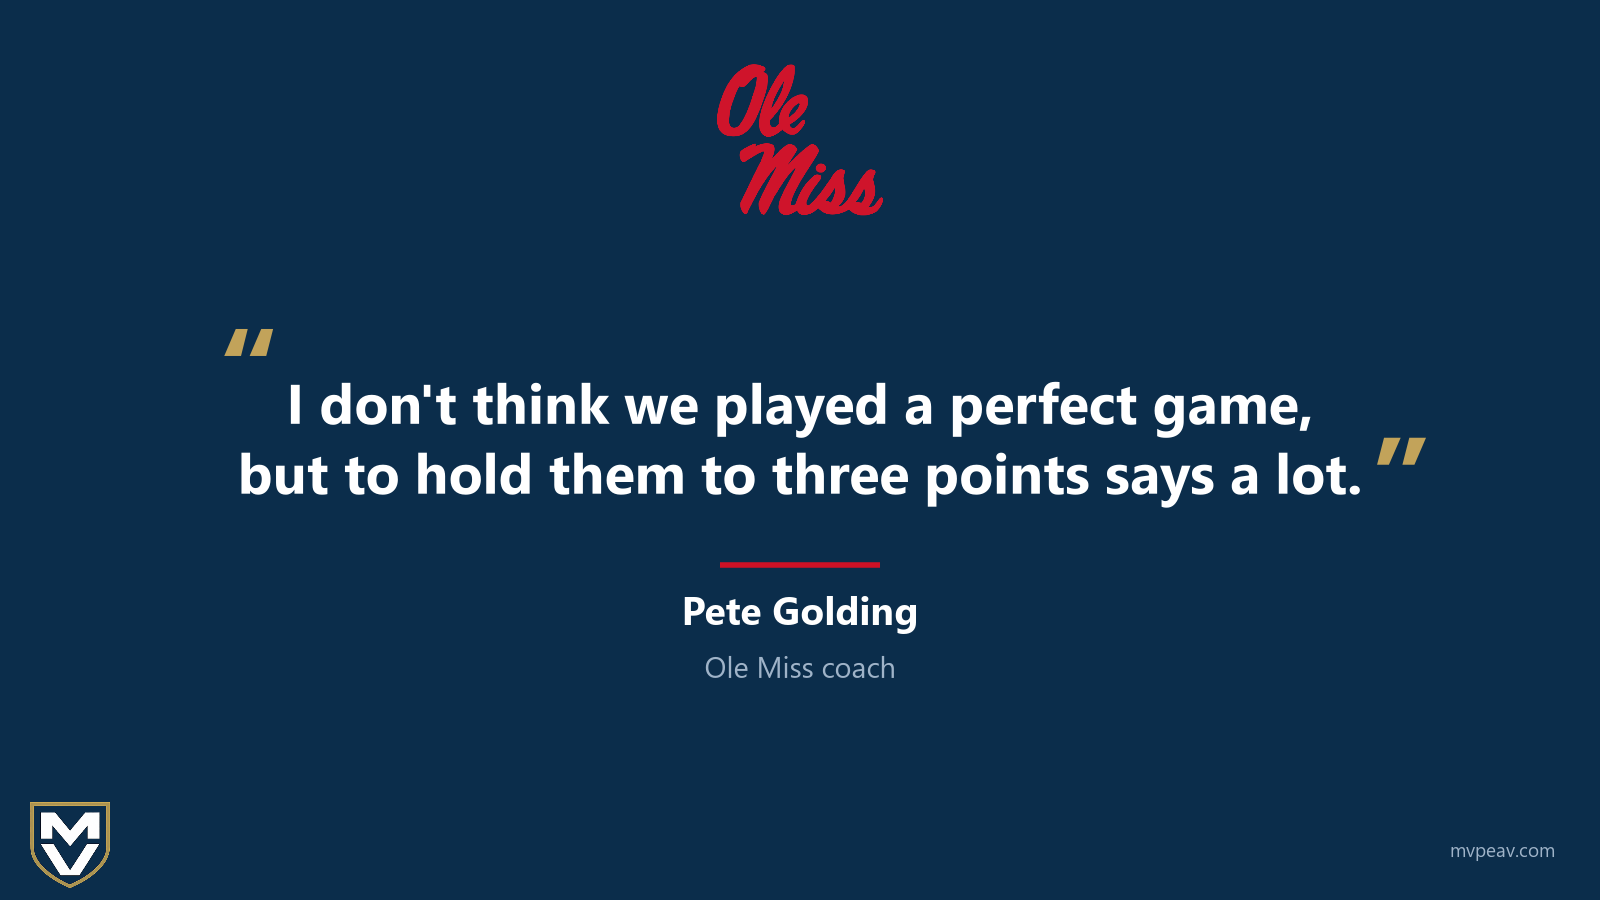
Missouri's 3 points came in 27 below the sims' median. Only about 0.46% of the 10,000 sims had Missouri that low or lower. Fewer than 1 in 200. When your 57% lean loses by 28, the problem isn't the coin flip, it's that the sims never saw that versions of Missouri offense existing.
Then the undercard. Texas (79.0%) lost to Florida 27-24. Memphis (77.5%) lost to Tulane 31-17. Notre Dame (71.4%) lost 28-24 at BYU. Kentucky, at 32.6%, won at Oklahoma 21-13. And North Carolina beat Duke 24-20 in a game where the sims had Duke at 80.3% and FPI had it at 53.9%.
Are Our 75% Favorites Actually Winning 75%?
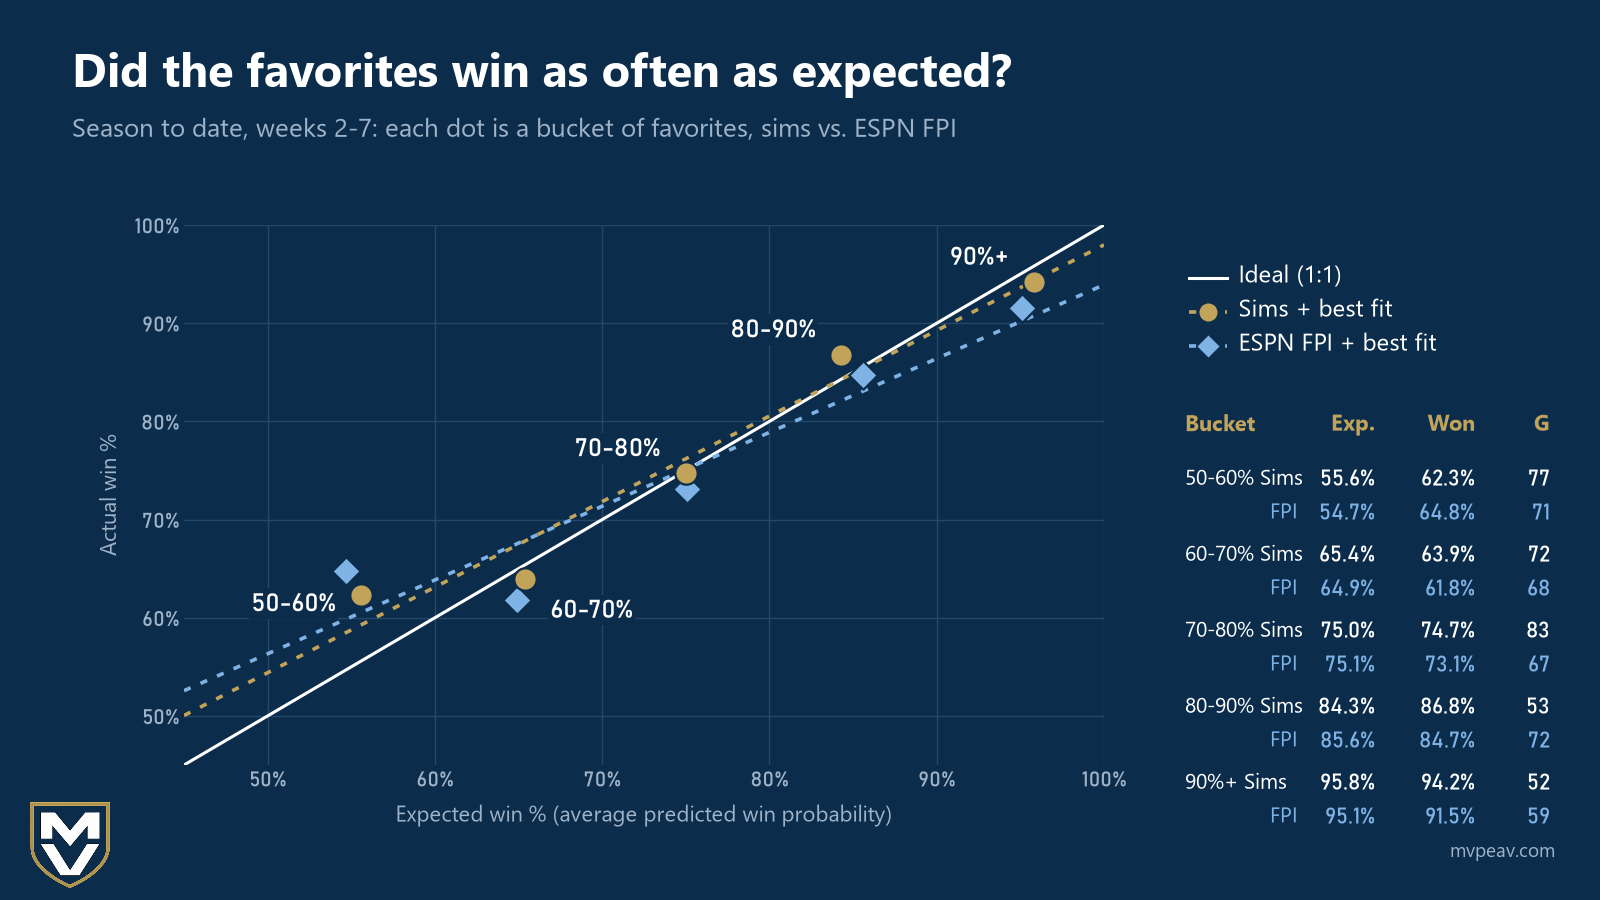
This is the question that matters more than any single week, because a prediction tool that says 75% should lose a quarter of those. If it loses 10%, it's underselling itself. If it loses 40%, it's lying.
The 70-80% favorites have won 74.7% of the time against an expected 75.0%. That's 83 games. That is as close to nailed as calibration gets.
The 80-90% group has won 86.8% against an expected 84.3% across 53 games, so they're slightly outperforming.
The 90%+ group is where Temple lives. Those favorites have won 94.2% against an expected 95.8% over 52 games. A little short. FPI's 90%+ favorites, for comparison, have won 91.5% against an expected 95.1% over 59 games. Theirs runs further off than ours does at the top end. So when a Charlotte happens, it's happening to everybody, and it's happening to them a little more.
The one that makes me go hmm is the 50-60% bucket. Those coin-flip favorites have won 62.3% of the time against an expected 55.6%, across 77 games. The sims are a little too humble when they lean. That's a lot nicer problem to have than the opposite, but it is a thing to fix or a place to expect some regression.
So Do You Trust the Sims This Saturday?
Three straight weeks right around the same number: 69.6% in week 5, 69.0% in week 6, 69.5% in week 7. The high-water mark was week 3 at 49-8, which was 86.0% and is clearly never happening again. Week 6 was the floor.
The FPI comparison is the honest headline. On the season, when the sims and FPI disagree on the winner, the sims are 19 of 39. Just under half. FPI took weeks 2 and 5 head to head, the sims took week 7, and the whole season is one game apart. Neither of us has found an edge on the other.
Where I'm at: the calibration has impressed me all season. The 70-90% favorites are winning almost exactly as often as they should, and the ranges are catching finals where they're supposed to. That's the stuff that tells you a tool is real, and it's earned at least as much trust as the general public hands FPI without thinking about it.
It hasn't earned more than that yet tho. It hasn't earned "ignore FPI." What it's earned is a seat at the table, and after the week Georgia, Alabama and Missouri had, the sims and I both have a little tape to go watch before Saturday. Let's look forward to a great week ahead of us!